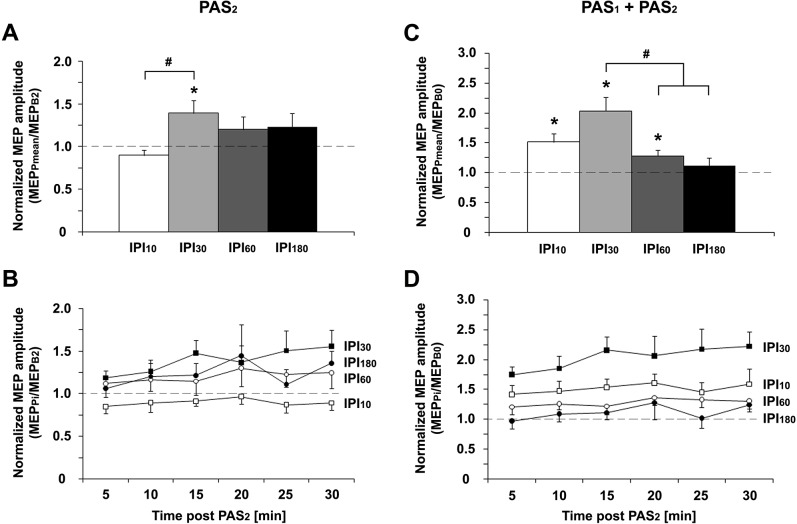
Fig 3. PAS2-induced increases in MEP amplitude after PAS1-priming.
A: The PAS2-induced increase in MEP amplitude after PAS1-priming (MEPPmean/MEPB2) was significantly higher at IPI30 than IPI10 (#, P < 0.05; paired two-tailed t test). B: Time course of MEPPi/MEPB2 (i = 1,2,…,6) over 30min after PAS2 for IPI10 (open squares), IPI30 (filled squares), IPI60 (open circles), and IPI180 (filled circles). C: The cumulative effect of PAS1 and PAS2 on MEP amplitudes (MEPPmean/MEPB0) was significantly higher for IPI30 than for IPI60 and IPI180 (#, P < 0.05; paired two-tailed t tests), and showed a trend to be higher for IPI30 vs. IPI10 (P = 0.095; paired two-tailed t test). D: Time course of MEPPi/MEPB2 (i = 1,2,…,6) over 30min after PAS2 for IPI10 (open squares), IPI30 (filled squares), IPI60 (open circles), and IPI180 (filled circles). *, P < 0.05; one-sample two-tailed t tests. Data are means ± 1 SEM from twelve subjects.

