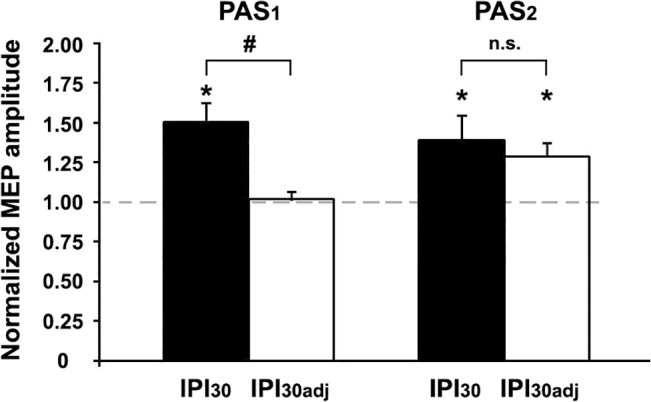
Fig 4. PAS2-induced increase in MEP amplitude after PAS1-priming in the control experiment (IPI30adj).

MEP amplitudes at time point B2 immediately before PAS2 were successfully readjusted by reducing the stimulation intensity (SI'1mV) to match baseline MEPs at time point B0 (PAS1, MEPB2/B0). Despite this readjustment, PAS2 induced a similar increase in MEP amplitudes in the control (IPI30adj) compared to the main experiment (IPI30) (PAS2, MEPPmean/MEPB2). *, P < 0.05, one-sample two-tailed t tests; #, P < 0.01, unpaired two-tailed t test. Data from the control experiment are from nine subjects, means ± 1 SEM.
