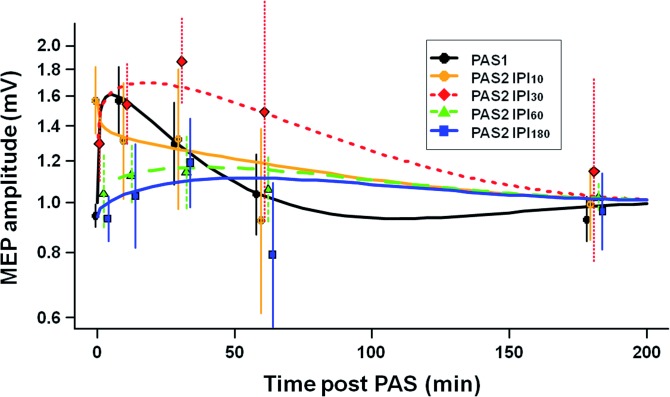
Fig 5. Computational modeling of the time course of PAS1 and PAS2 effects.
MEP amplitudes as a function of time modeled from the experimental MEP raw data independently for PAS1 and PAS2 at all IPIs. PAS1 and PAS2 model functions, i.e. the time course of MEP amplitude changes after PAS1 vs. those after PAS2, were significantly different at all IPIs (P < 0.0001 each). In addition, PAS2 effects at IPI10 and IPI30 were significantly different from PAS2 effects at IPI60 and IPI180 (P < 0.0001), and PAS2 effects at IPI10 from PAS2 effects at IPI30 (P = 0.033), but not PAS2 effects at IPI60 from those at IPI180 (P > 0.5). Experimental data are shown as mean ± SEM. Note that data for PAS2 at time points 60min and 180min post PAS2 are from six subjects only, whereas all other data are from twelve subjects (see Material and Methods). Y-axis, logarithmic scaling.

