
Fig. 4.
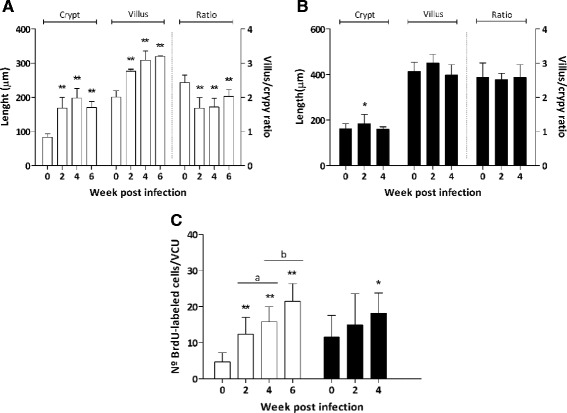
Crypt depth, villi length and villus/crypt ratio in the site of infectionwith Echinostoma caproni in mice (a) and rats (b) at different weeks post infection (wpi). c Number of BrdU-labeled cells accumulated per villus/crypt unit (VCU) 24 h after BrdU administration in the intestine of mice (white bars) and rats (black bars) at different wpi. Results are expressed as mean ± standard deviation. Asterisks indicate significant differences with respect to uninfected controls (0 wpi) for each host species (*p < 0.05; **p < 0.0001). Horizontal bars indicate differences between infected animals at different wpi (a: p < 0.05; b: p < 0.05)