
Fig. 6.
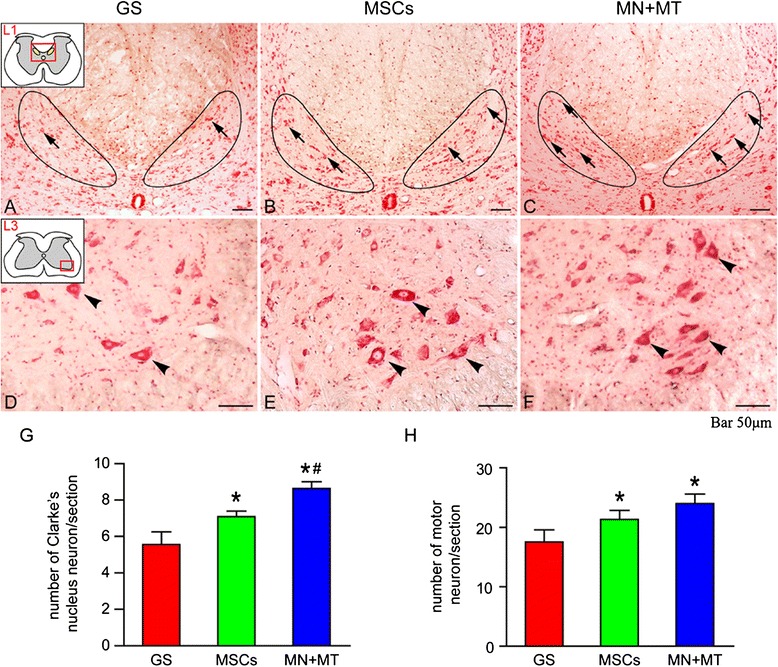
The survival of injured host neurons in L1 Clarke’s nucleus (CN) and L3 ventral horn of spinal cord at 8 weeks after cell transplantation. a–c Neural red staining of L1 CN in the gelatin sponge (GS) (a), mesenchymal stem cells (MSCs) (b), and NT-3-MSCs (MN) + TrkC-MSCs (MT) (c) groups. Arrows indicate the survival neurons in CN. d–f Neural red staining of L3 ventral horn in the GS (d), MSCs (e), and MN + MT (f) groups. Arrowheads indicate the survival neurons in ventral horn. g, h Bar charts show the number of survival neurons in CN and ventral horn. In the MN + MT group, the number of survival neurons in CN was more than in the MSCs and GS groups (g) (*P < 0.05, # P < 0.05). The number of survival neurons in ventral horn was more in the MSCs and MN + MT groups compared with the GS group (h) (*P < 0.05). One-way analysis of variance with least significant difference test statistics was performed to compare the number of survival neurons. Scale bars = 50 μm