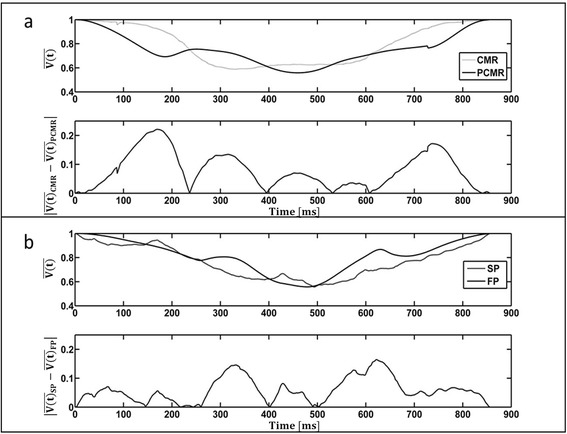
Fig. 9.

Comparison of the normalized volume through the LV, as a function of the cardiac cycle time, between (a) cardiac magnetic resonance and phase contrast cardiac magnetic resonance and (b) stereo-photogrammetry and inline flow probes . The absolute values of the difference between the modalities compared in (a) and (b) are also shown as a function of the cardiac cycle.
