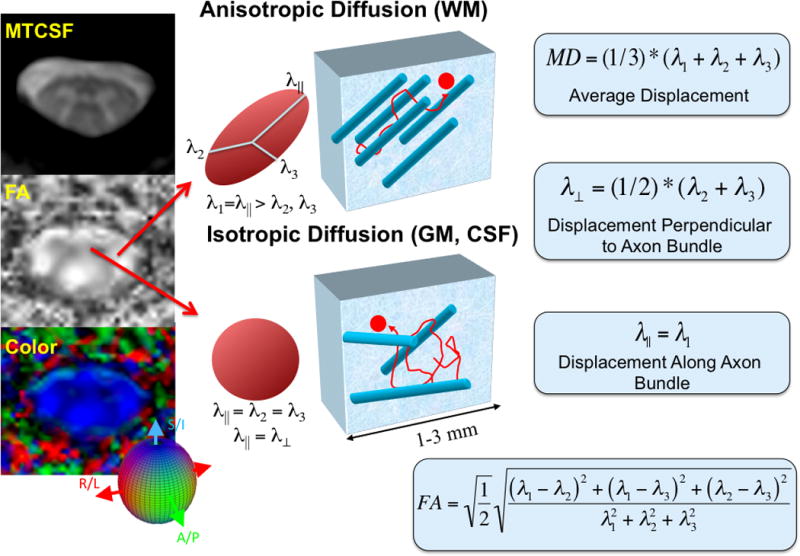
Figure 2.

Cartoon representation of conventional DTI methodology in the cervical spinal cord. In the left column, FA and colormaps of the cervical spinal cord are compared with an MTCSF image. The gray matter “butterfly” can be seen in both the FA and colormaps. In the middle panel, a visual description of tissue anisotropy for different regions of the spinal cord is presented. Note that in the anisotropic case (white matter), the principle Eigenvalue, λ‖ is greater than the orthogonal Eigenvalues, while in the isotropic case (gray matter), the three Eigenvalues are equal. At far right, metrics derived from DTI data are defined.
