
Figure 3.
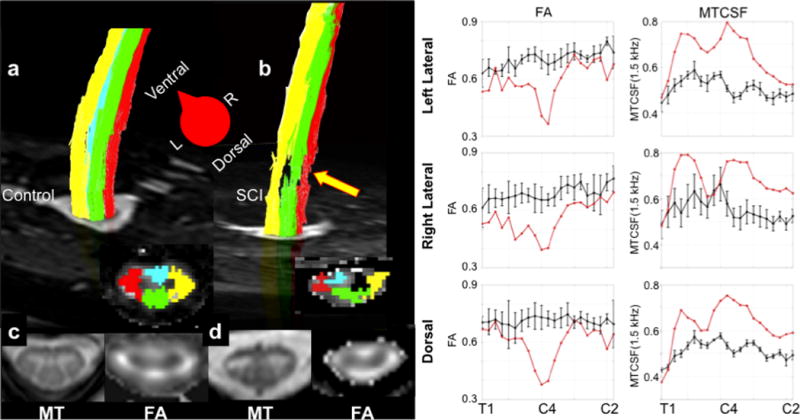
Multi-modality imaging of the cervical spinal cord in a healthy volunteer and a patient with chronic spinal cord injury. a) and b) show reconstructed fiber pathways for the dorsal (green), lateral (right – red, and left – right). Note in the spinal cord injury case that fiber pathway damage is plainly visible (arrow). c) and d) show the MTCSF and FA maps at the level of the injury – C5 – in the spinal cord injury case and in the healthy volunteer. While the FA is high in the left lateral and dorsal columns, it shows a marked decrease in the right lateral column for the patient. The far right columns show tract-profiles for MTCSF and FA for the left lateral, right lateral, and dorsal columns for healthy volunteers (black) and the same patient presented in b). Note that FA decreases focally at the site of the lesion, but is close to normal rostral and caudal to the lesion. In contrast, the MTCSF values are elevated along the entire cervical cord. Figure modified from Smith SA, NMR in Biomedicine, 2010.