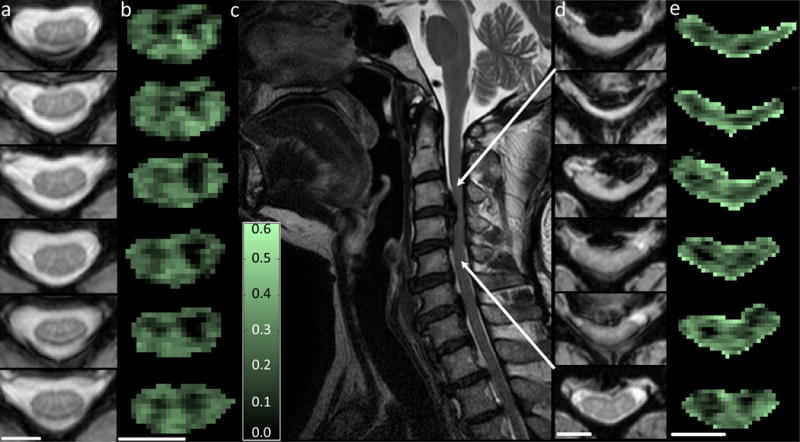
Figure 5.

Demonstration of the quantitative T2 approach: myelin water fraction (MWF) images from a healthy control and a patient with cervical spondolysis. In the left panels, T2-weighted and MWF maps of a healthy control are presented. The GM has a low MWF while the white matter appears brighter. In the center and right panels, a patient with cervical spondolysis is shown; the disc between C3–C4 is making contact with the spinal cord. The MWF maps at the site of spondolysis show a change in the myelin water fraction in each column, while, caudal to the lesion, the MWF maps appear normal. Images courtesy Dr. Alex MacKay and Dr. Erin Macmillan, University of British Columbia.
