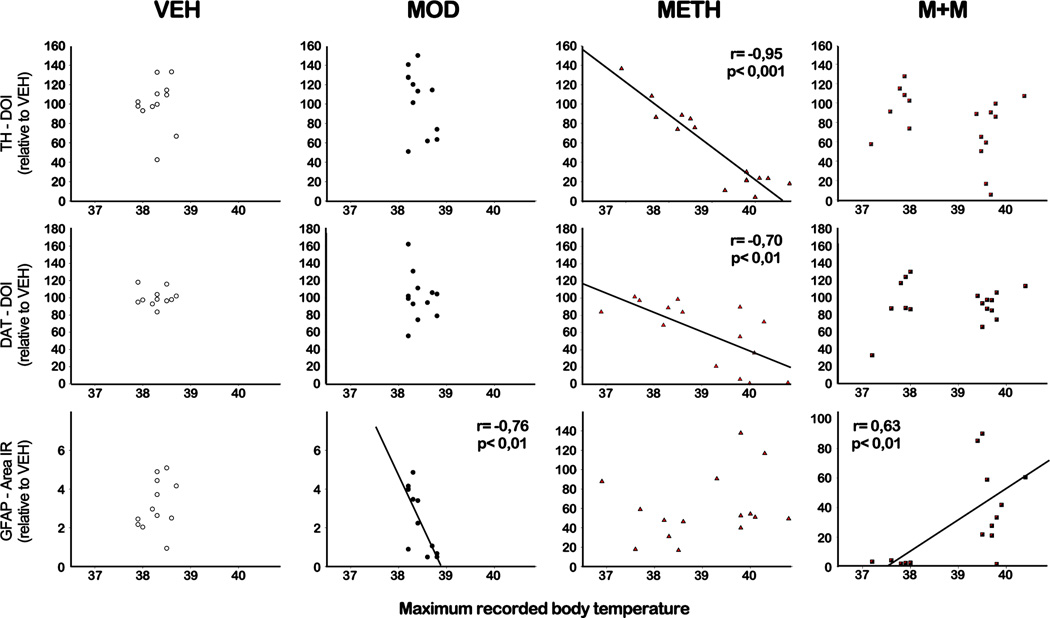
Figure 5. Correlation analysis between core body temperature and toxicity markers immunoreactive levels in the striatum.
Pearson correlation analysis was performed between maximum core body temperatures reached by each mouse during the treatment at 14 and 29 °C ambient temperatures and TH (upper panel), DAT (middle panel) or GFAP (lower panel) immunoreactivity. The Pearson r coefficient is shown on the graphs when p<0.05.

