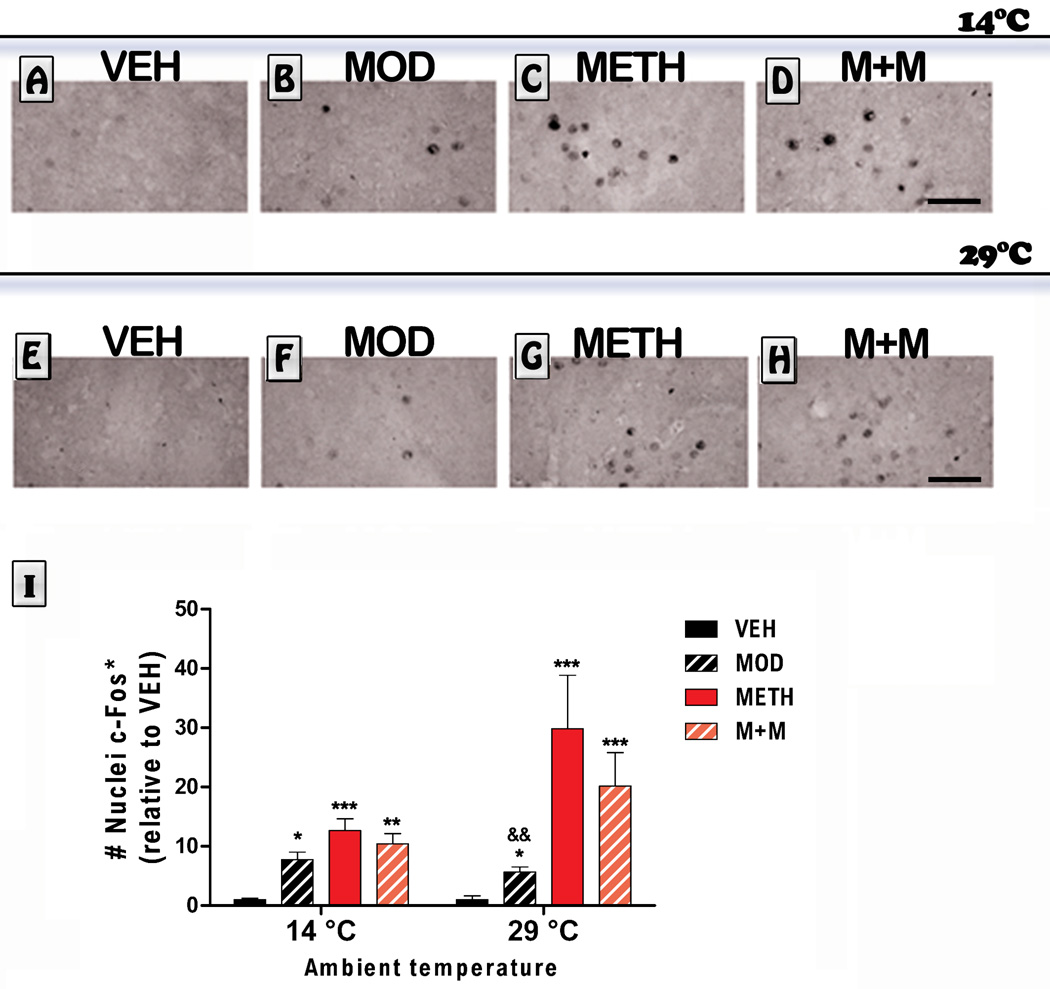
Figure 6. Effects of modafinil (MOD) on METH-induced striatal c-Fos immunoreactivy evaluated at 14 and 29 °C ambient temperatures.
Representative images of the striatum from animals treated with either VEH (A, E), MOD (B, F), METH (C, G) or M+M (D, H), scale bar: 50 µm. Mice were euthanized 1 h after the last METH injection and brains were processed for c-Fos immunoreactivity in a region of interest located in the dorsolateral striatum. Values are expressed as mean ± SEM (relative to VEH), (n = 5–11). Two way ANOVA followed by Bonferroni. *: p<0.05, **: p<0.01, ***: p<0.001 vs. VEH of same ambient temperature; &&: p<0.01 vs. METH of same ambient temperature.

