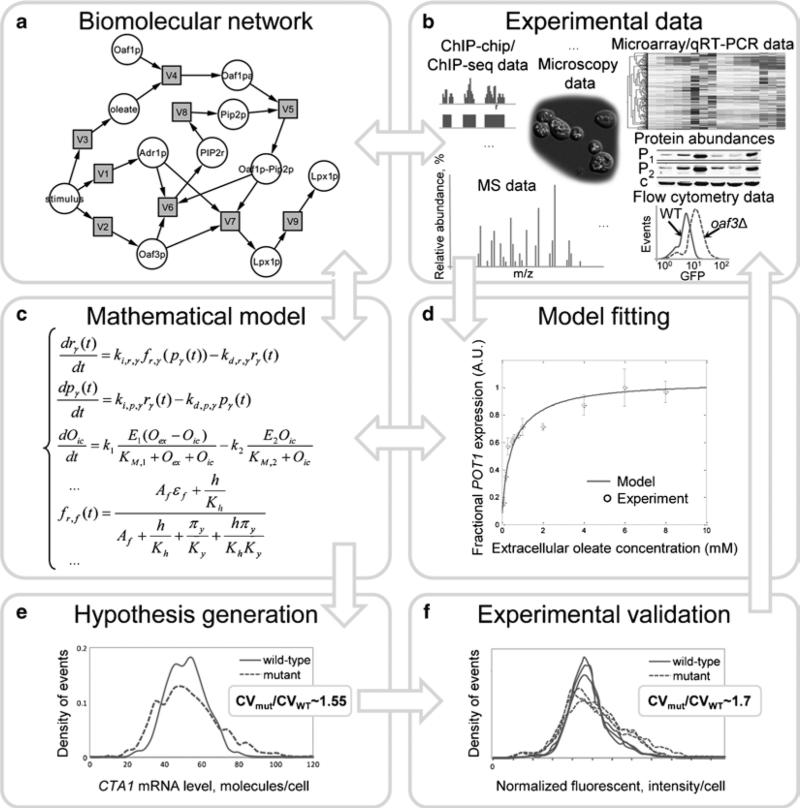
Fig. 1.
Workflow of the theoretical and experimental analysis of biomolecular network dynamics (the model building cycle). Arrows denote information flow, illustrating how the model can lead to the formulation of hypotheses that can be experimentally tested. The results from experimental validation of the model are used to improve the model, and simulations from the refined model can lead to new predictions. (a) Diagram showing regulatory network controlling oleate response in yeast. (b) Types of data used in systems biology. (c) Equations showing the structure of the ordinary differential equation (ODE) model of the oleate response network. (d) Predicted and measured steady-state dose-response of the oleate-inducible target gene, POT1. (e) Predicted cell population distributions of the mRNA level of an oleate-inducible gene in the wild-type oleate network and in a perturbed (“mutant”) network. (f) Measured cell population distributions of the level of a GFP-tagged, oleate-inducible protein in wild-type yeast and in a yeast strain bearing a mutation corresponding to the network perturbation in the “mutant” model.

