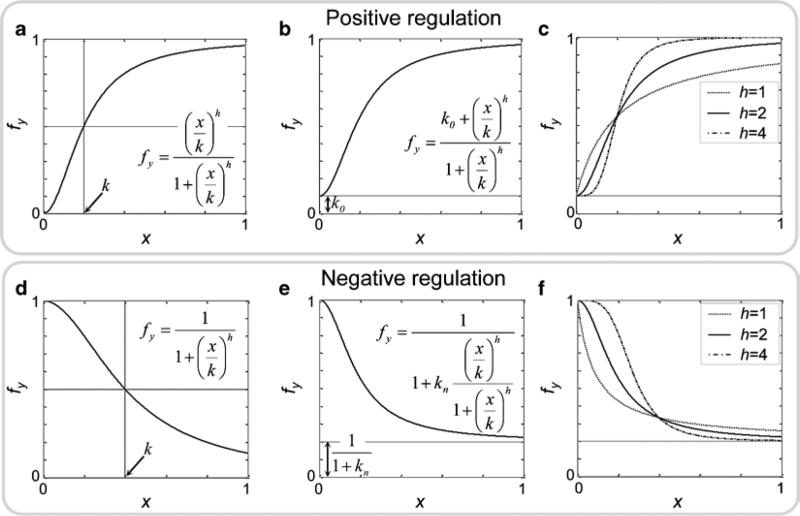
Fig. 2.
Examples of regulation of transcription of a gene y by a single regulator x and their formal descriptions using a fractional activity function fy(x). Plots show the simulated dependence of the fractional activity on the level of regulator x, for different regulatory scenarios (positive and negative regulation) and for different kinetic parameter values. (a) Gene y has no basal level of expression. (b) Gene y has a constitutive level of expression (k0). (c) Dependence of fy on the level of activator (x) with the different cooperative activities (Hill coefficients, h). (d) Simplest formal description of negative regulation. (e) Partial negative regulation (kn). (f) Dependence of fy on the level of the inhibitor (x) with different cooperative activities. The following parameters were used for the simulations: k0 = 0.1; k = 0.2 (a–c); k = 0.4 (d–f); kn = 4; h = 2.

