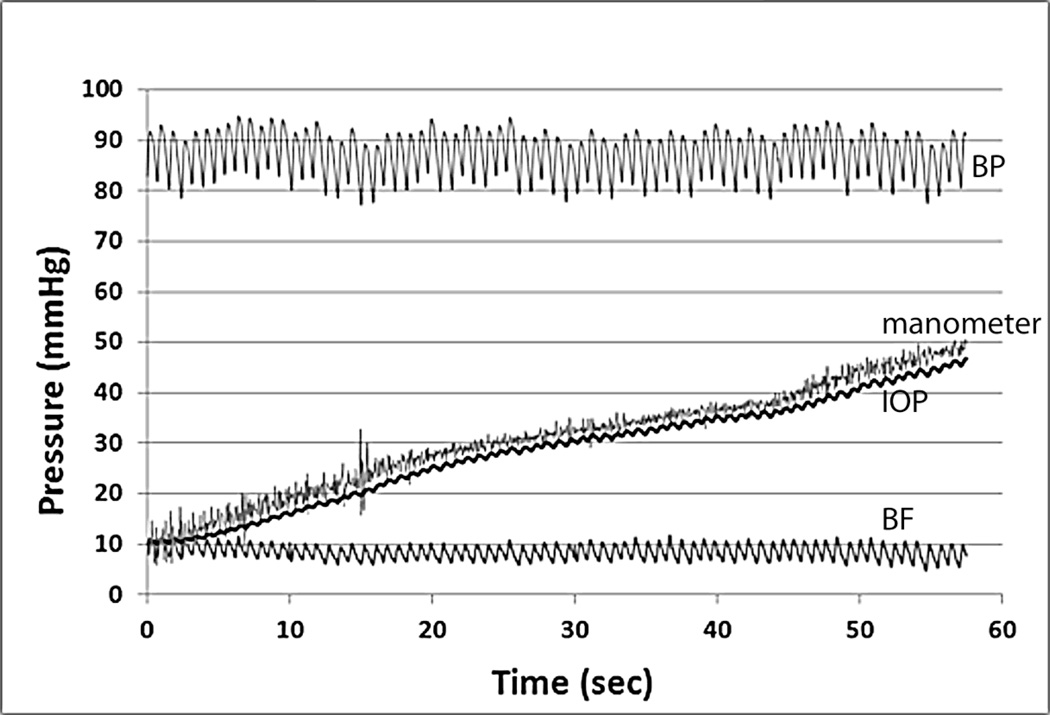
Figure 3.
The graph shows a representative test of slow IOP increase from Exp 2. From the top to bottom are the recordings of BP (top), manometer pressure and IOP (middle two traces), and ONH BF (bottom). While the IOP increased continuously, the BP remained constant. Note the ONH BF recorded by LSFG showed almost no change during the IOP elevation in this example.

