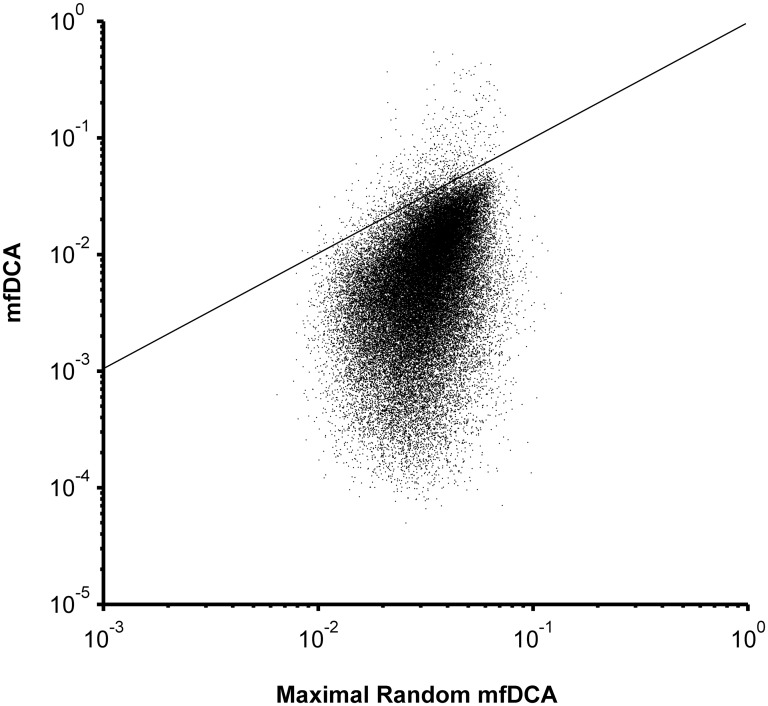
Fig 1. Comparison between mfDCA coupling values for Clade B gp120 based on the observed MSA or on the same MSA with scrambled columns.
The amino acid residues in each column were randomly reordered and 100 different MSA with scrambled columns were thus generated. The mfDCA was performed on each of the 100 scrambled MSA and the maximal coupling values for each pair of positions (X) was related to the value from the observed MSA (Y). The maximum coupling value obtained after 100 permutations for each pair of positions was used as an upper limit of the random distribution of values for that pair. Thus, the dots above the diagonal represent the couplings, for which the actual mfDCA values were above the 99 percentile of the random coupling distribution. These mfDCA were considered significant and were used further in the analysis while the rest were replaced by zeros.

