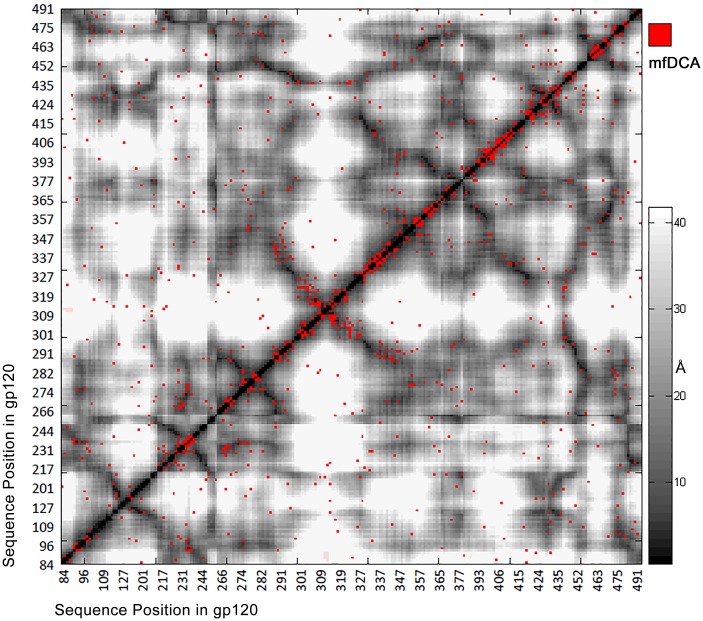
Fig 2. mfDCA coupling overlaid on the contact map of 2B4C.G structure.
Significant couplings are marked with red dot to the background of gray level coded distances in angstroms. As expected, most of the significant values were along the diagonal indicating both primary and tertiary structure proximity. Those of highest intensity were aligned on the diagonal (not shown). A number of long range interactions (red dots in white areas) are observed also.

