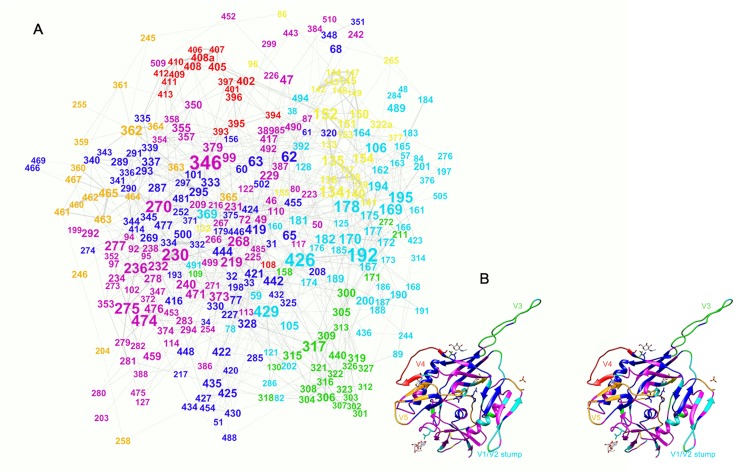
Fig 3. Graph representation of the interacting pairs.
(A) The layout was constructed using Force Atlas 2 algorithm (Gephi). The size of the label (amino acid position number) correlates with the degree of the respective node in the graph. The modularity analysis of the graph yielded 7 modularity classes—color coded. The mapping of the major modularity classes on the 2B4C gp120 structure (B—stereo view) shows a good agreement with secondary and tertiary structure units. The V3 (green), V4 (red) and V5 (ochre) loops overlap with three separate classes, while V1/V2 fall into a class colored yellow. The logic of the visualization algorithm pulls cliques to the periphery and in the case of gp120 these are represented most notably by V4 and V5 and, to a lesser extent—V1/V2. Even the spatial relationships between these structures are marked although projecting on 2D plane distorts them. The only major discrepancy is the position of the V3 loop, but it is important to note that 2B4C structure represents the bound conformation of gp120 and the V3 loop in the unbound state seems to be positioned rather where the graph suggests. Thus the layout algorithm used reconstructed the main structural relations in gp120 based on the mfDCA coupling analysis.

