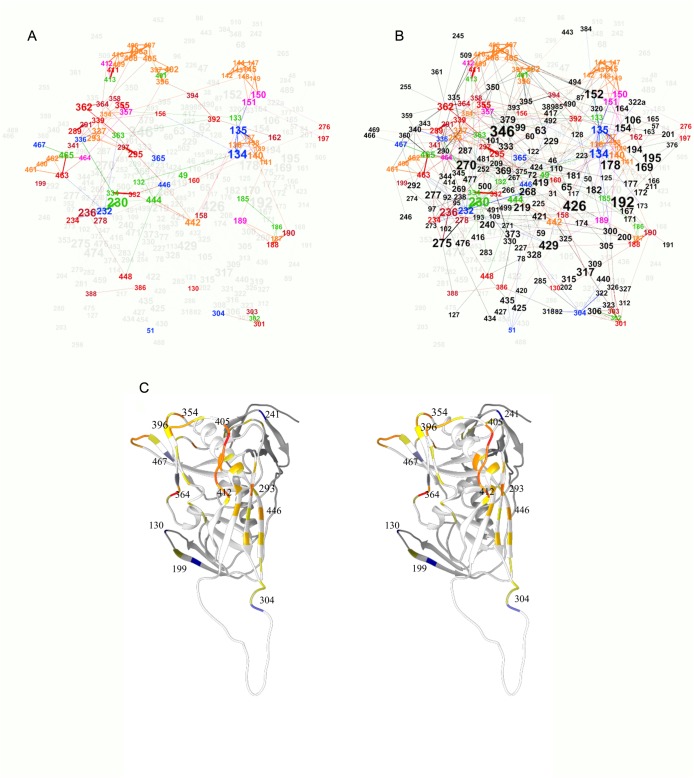
Fig 5. Mapping the sequon related positions of the potential N-glycosylation sites on the graph of mfDCA couplings.
(A) “Variable”—ochre for N and magenta for S/T, “Frequent”—red –N, bordeaux –S/T and “Rare”—green—N, blue—S/T for. The P3 (S/T) positions appear less than the P1 (N) positions because N was selected to represent the position when the P1 and P3 overlapped for adjacent sequons. Overall, the sequons formed two connected subgraphs leaving out positions 49, 51, 130 and 199. The variable V1/V2, V4 and V5 regions represented tight cliques in the large subpgraph while p301–304 formed the smaller subgraph. The ego network (all immediately connected positions) of the sequons (B), was a highly connected and included a large part of the non-sequon positions. Therefore, it seems most of the sequons are closely interrelated but do not segregate from the rest of the structure. Even the variable loops cliques are bound by numerous relations to the rest of the graph. (C)–The sequon related positions mapped on the 2B4C structure in stereo view are color coded for their epistatic coupling to other sequon positions (red), to non-sequon positions (blue) or to both equally (yellow). If the proportion of sequon position related couplings is above 0.5 the color is orange, if less than 0.5 –gray. The predominantly sequon coupled positions are found in V4 but mostly in V1/V2 (not shown) as well as 293 and 446 in the middle of the cluster on the outer domain. The most “structure related” sequon positions are 130, 199, 304, 368, 467 and 241.

