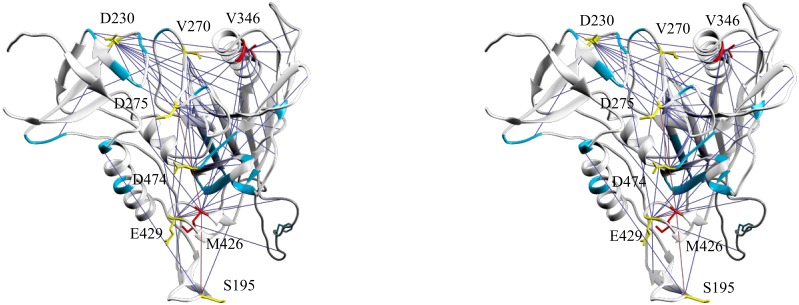
Fig 6. Map of the sites with the highest betweenness centrality values on the 2B4C structure—a stereo view.
Red—group 1, yellow—group 2, cyan—group 3 (only positions in groups 1 and 2 are labeled). These positions are found in the membrane proximal part of the inner domain, the bridging sheet and the CD4 binding site. The pseudo-bonds indicate the immediate mfDCA couplings (ego network) of the positions in the 3 groups. (The Chimera file is S4 File).

