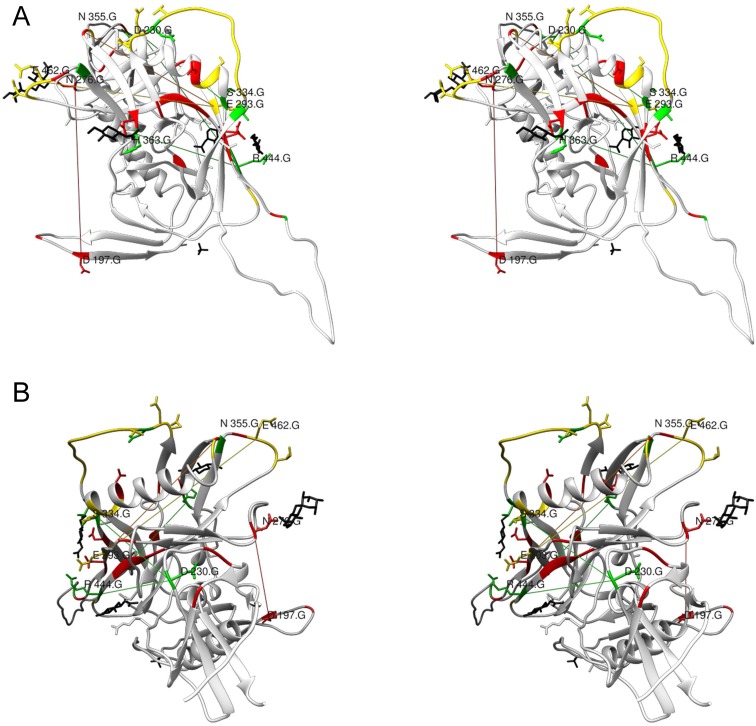
Fig 8. The long range sequon to sequon interactions mapped onto the 2B4C structure.
A—Stereo view perpendicular to the axis of the trimer, B—stereo view form the membrane proximal region along the axis of the trimer. The sequence related positions are color coded for their frequency/entropy (rare—green, variable—yellow, frequent—red). For a more precise inspection see the Chimera file (S3 File).

