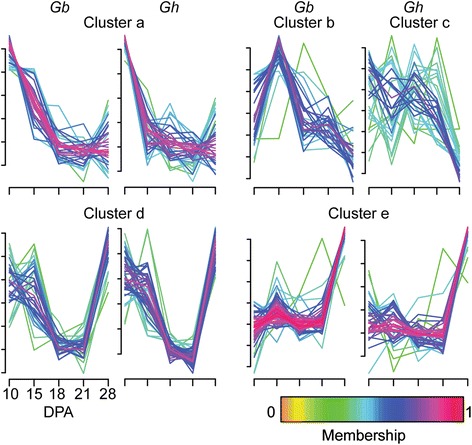
Fig. 3.

Four clusters of Gb and Gh fiber metabolites included three that were similar between genotypes. Metabolites with changes in concentration during fiber development (p ≤ 0.05) were clustered. The x-axis is as defined for Fig. 2. The y-axis is the scaled imputed mean value of metabolite concentration standardized to mean = 0 and standard deviation = 1. Color coding is as described in Fig. 2
