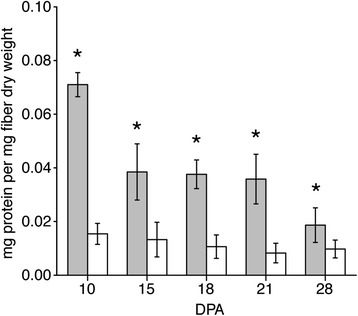
Fig. 4.

Total protein content in 10 to 28 DPA Gh and Gb fiber. Total protein was determined by Bradford assay and normalized to the dry weight of Gb (grey bars) and Gh (white bars) fiber. Mean values ± SD derive from 5 biological replicates at each DPA. Asterisks indicate a significant difference (p ≤ 0.017) between genotypes at each DPA as determined by t-test
