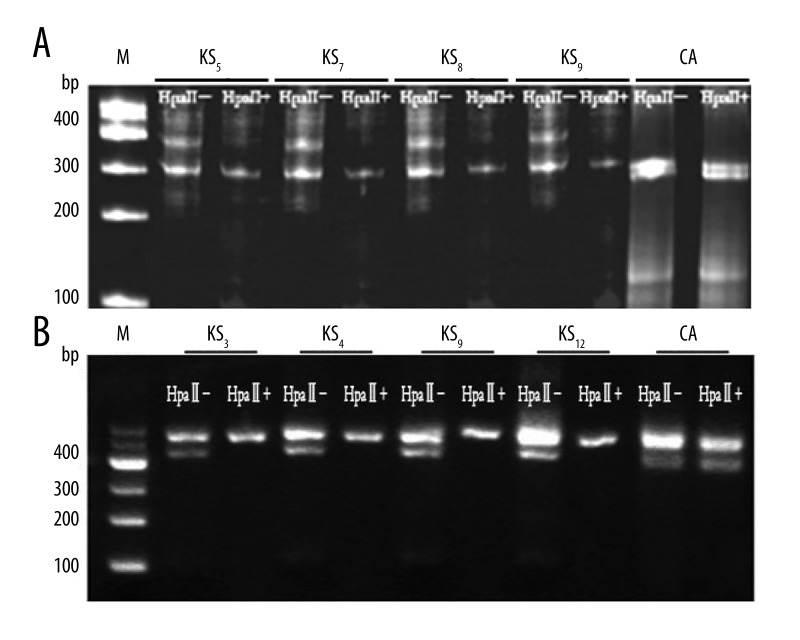
Figure 2.
Clonality analysis in HUMARA (A) and PGK (B) gene of representative KS and cutaneous hemangioma. KS – Kaposi sarcoma; CA – cutaneous hemangioma; M – DNA marker; HpaII+ – with HpaII digestion; HpaII– – without HpaII digestion. KS indicated monoclonal samples. Before HpaII digestion there were 2 bands, and the intensity of the other band was lower. CA indicated polyclonal samples, with and without HpaII digestion; there all were 2 bands, but the latter band was lower intensity than the former band.

