
Figure 5. Knowledge-based Pathway analysis.
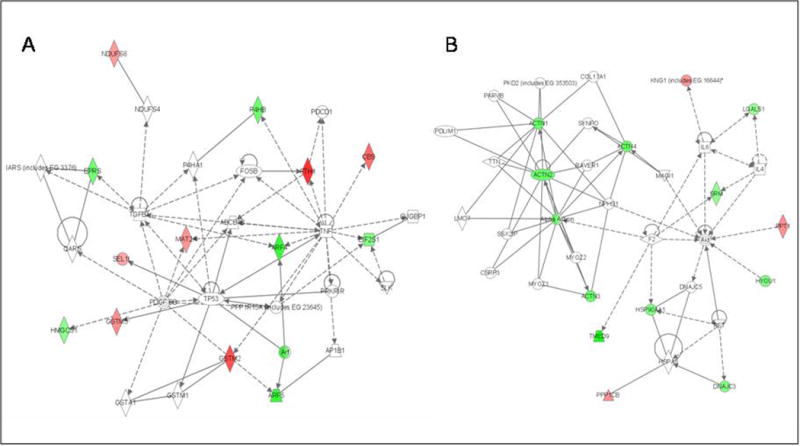
Twenty-four of the differentially expressed proteins were principally mapped to 2 networks. A) Network 1: cell-to-cell signaling and interaction/cell growth and connective tissue (with 6 proteins directly connecting to one distinct inferred network node, TNF-α). B) Network 2: cellular compromise, cellular function and maintenance, cell signaling. Participating proteins are represented in the network by their Entrez Gene official symbols, with increased expression represented by red nodes and decreased expression by green nodes.