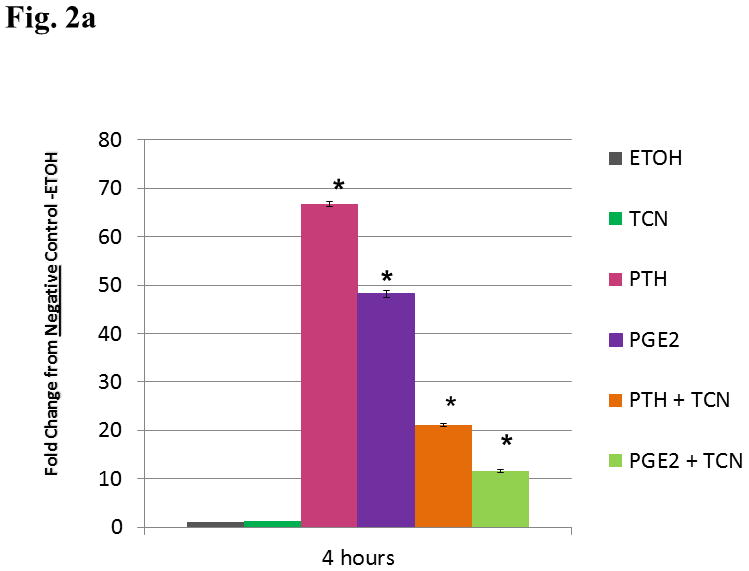
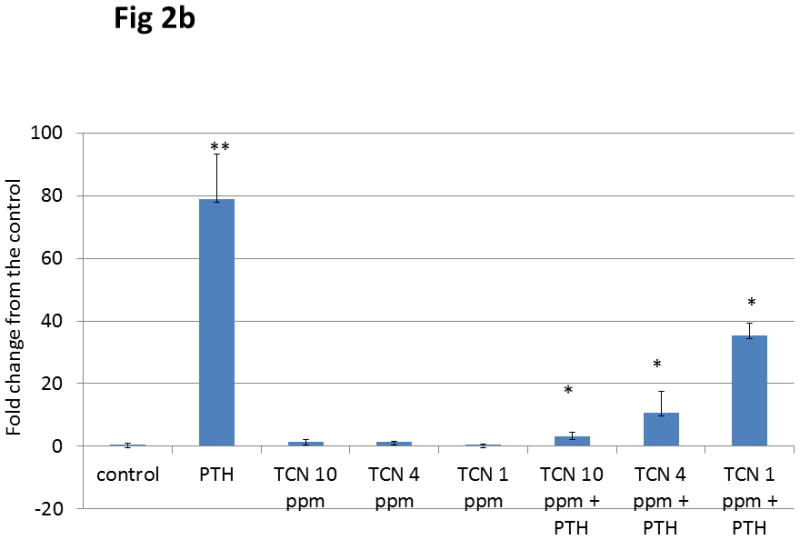
Figure 2. Expression of Mmp-13 by UMR Cells stimulated with PTH or PGE2 and TCN.


a. UMR cells were treated with ethanol vehicle, 0.003% triclosan, 10−8 M PTH, 10−6 M PGE2, PTH + triclosan or PGE2 + triclosan. At a 4 h time point expression levels of Mmp-13 mRNA were measured as fold stimulation. Statistical analysis found no significant difference between TCN treated cells and ETOH. Cells stimulated with PTH, PGE2, PTH + TCN, and PGE2 + TCN were significantly different from cells treated with ETOH or TCN alone.* (p<0.05) The addition of TCN to PTH stimulated cells produced a statistically significant decrease from the cells treated with PTH alone** (p< 0.05). The addition of TCN to PGE2 stimulated cells produced a statistically significant decrease from cells treated with PGE2 alone *** (p<0.05).
b. Dose Response with Triclosan UMR cells were treated with ethanol vehicle, 10−8 M PTH, and/or a dose response of TCN of 1, 4 or 10 ppm. Messenger RNA was analyzed after 4 h treatment. Results are depicted as the fold change from the ethanol vehicle. Means ± SD of triplicate measurements are indicated. PTH produced a 78.844 (± 14.45) as compared to negative control (ETOH). The addition of triclosan in the dose of 10 ppm, 4 ppm, and 1 ppm registered a 1.518 (± 0.702), 1.424 (± 0.162), 0.417 (± 0.239) fold change vs. ETOH respectively. The addition of triclosan (again at 10, 4 and 1 ppm) to PTH stimulated cells produced a 3.011 (± 1.498), 10.559 (± 6.869), 35.383 (± 3.934) fold change vs. ETOH respectively. PTH was found to be significantly different from the control **(p<0.05). The addition of TCN at all doses to PTH stimulated cells were found to be significantly different from PTH stimulated cells. *(p<0.05)
