Figure 3.
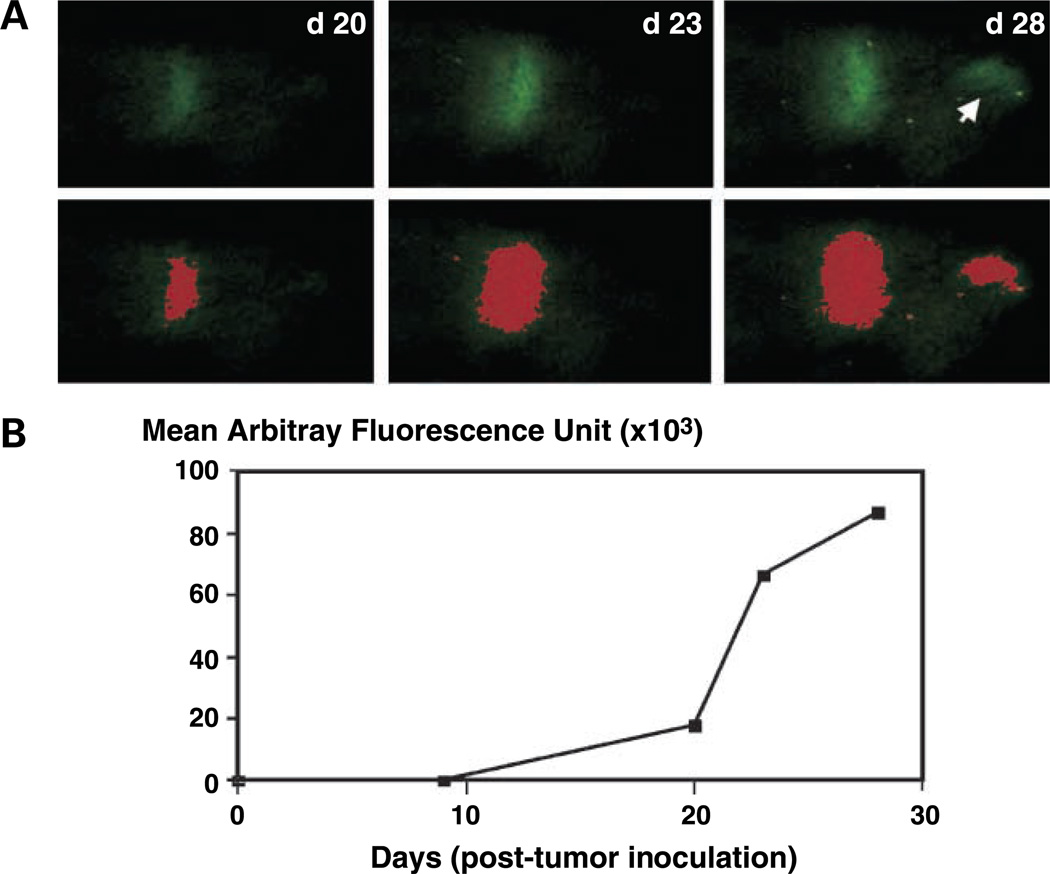
Real-time fluorescence monitoring of tumor growth in situ in individual bones of tumor-bearing mice. A, series of dorsal external fluorescence images of foci of myeloma tumors in calvaria of a 5TGM1-eGFP myeloma – bearing mouse from day 20 through day 28 post tumor cell inoculation (top). All images were acquired in identical fashion. Note the appearance of a second tumor focus between day 23 and day 28 post inoculation (arrow). No fluorescence was detected at baseline or at any time point before day 20 even after prolonged exposure of up to 60 s. For each time point, a computer-rendered digitized image of area of fluorescence was generated as described in Materials and Methods (bottom). Note that the threshold set allowed inclusion of a new tumor focus that appeared between day 23 and day 28 post inoculation. B, tumor growth curve determined from computerized analysis of serial images acquired as in (A) showing a time-dependent tumor progression.

