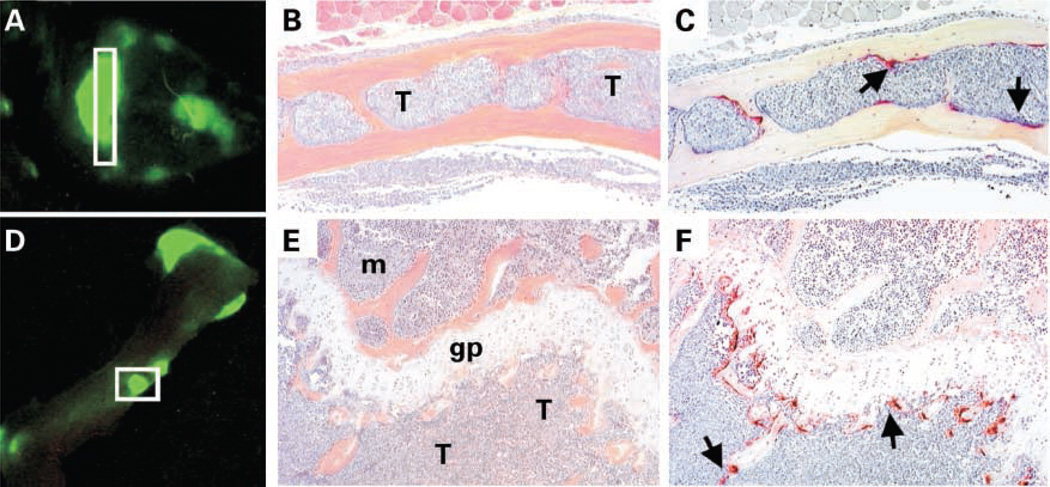
Figure 4.
Increased osteoclast activity associated with eGFP-expressing myeloma tumor cells in two different types of bone in vivo. A – C, skull; D – F, scapula/humerus. A and D, optical images of fluorescent tumor foci in skull and humerus, respectively, of a myeloma-bearing mouse obtained on day 28 post tumor cell inoculation. B and E, representative photomicrographs of sections through insets in (A) and (D) stained with H&E. C and F, serial sections stained for tartarate-resistant acid phosphatase activity (red stain) to reveal osteoclasts. The medullary cavity of the calvaria is completely infiltrated by tumor (B) and several osteoclasts (arrows) can be seen lining the interface between the endosteal surface of bone and tumor cells (C). There is also complete tumor infiltration of metaphysis of the humerus (E) associated with a marked increase number of osteoclasts (arrows; F). Note the absence of osteoclasts on the opposing side of the growth plate where normal marrow has not been replaced by tumor. T, tumor; m, normal marrow; gp, growth plate.

