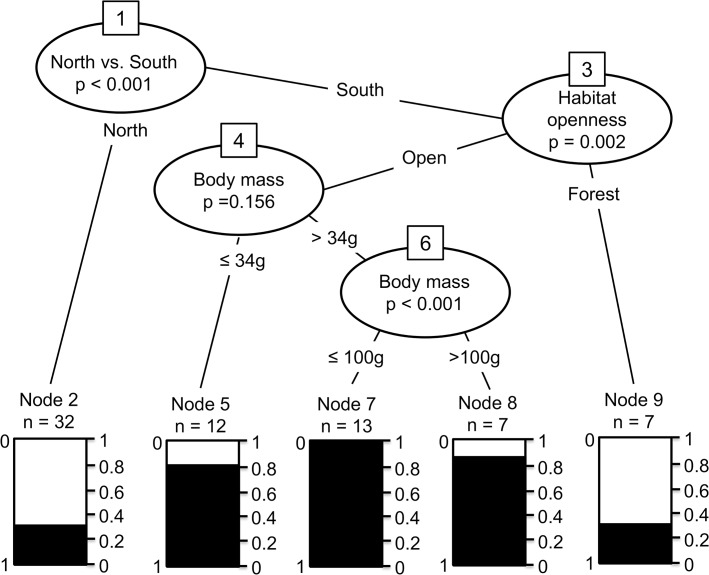
Fig 4. Conditional inference tree based on the variables most strongly associated with range decline from a random forest model.
Shading represents the proportion of species that have declined, and n is the number of species in each of the final groups. Numbers in boxes represent the node number at which each split occurred. Overall out-of-sample prediction error rate (overall misclassification rate) was 21%. Species at nodes 5, 7 and 8 have all declined greatly (>80% of species). Substantially more species at nodes 5, 7 and 8 (species of all body masses in non-forest vegetation types) have declined than at node 9 (species of all body masses in rainforest and forest vegetation types).

