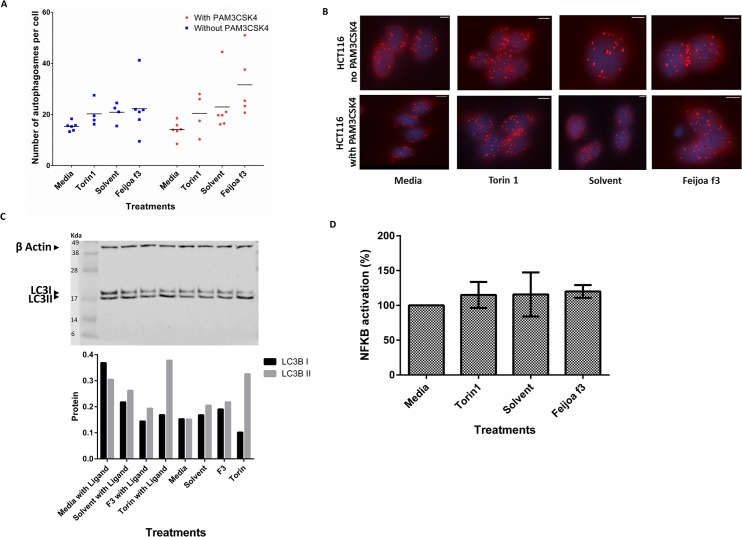
Fig 4. Feijoa F3 does not activate autophagy or inhibit NF-κB activity in autophagy defective HCT116 cells.
Cells were treated with media, Torin1 (1μM/ml), solvent and feijoa F3 (10mg/ml), in the presence and absence of 100ng/ml PAM3CSK4 stimulation. A and B show the number of autophagosomes in each cell. The puncta were quantified using the spot function in Imaris. Each experimental condition for solvent, media, and feijoa F3 had 3 biological replicates with two technical replicates (giving a maximum of 6 data points) and Torin1 had 2 biological replicates with two technical replicates (giving a maximum of 4 data points). Horizontal line represents median. B is an image representation of A. The spots in the cells are the spheres pseudo colored by the Imaris spot function representing the autophagosome puncta that were stained for by LC3B. C. shows western blot analysis of autophagy. The westerns show LC3B I (16kDa) and II (18kDa) protein bands. β-actin (42 kDa) was used as a control. The bottom graph is the semi quantification of the LC3 I and II band intensity scores, adjusted against β-actin band intensity scores. D shows the normalized percentage NF-κB activation. Percentage inflammation was calculated using Eq 3. A percentage of greater than 100 shows increased inflammatory response in the presence of the ligand when compared to media (no treatment); and a percentage of less than 100 suggests a decrease in the inflammatory response in the presence of the ligand when compared to media (no treatment) meaning that a condition has inhibited NF-κB signaling. Error bars represent standard deviation of (n = 6).

