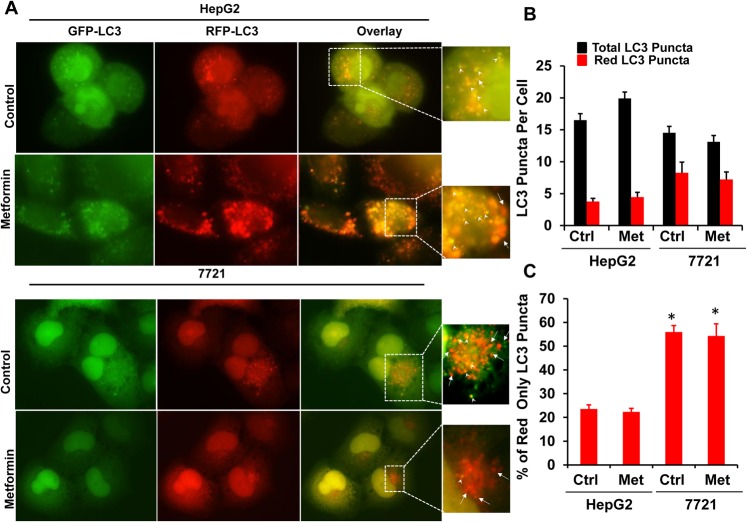
Fig 3. 7721 cells have higher basal autophagy than HepG2 cells regardless of metformin treatment.
(A). 7721 and HepG2 cells were infected with adenovirus RFP-GFP-LC3 (10 MOI) overnight and further treated with metformin (10 mM) for another 24 hours followed by fluorescence microscopy. Representative GFP-LC3, RFP-LC3 and overlay images are shown. Right panels are enlarged photographs from the boxed areas. Arrow heads: yellow puncta; arrow heads: red only puncta. (B-C) The number of yellow and RFP-LC3 (red only) puncta per cell was quantified. Total number of LC3 puncta is the sum of the number of yellow puncta and red only puncta. Data are presented as means ± SE (n = 3 independent experiments). * p<0.05, 7721 vs HepG2 (Student t test).

