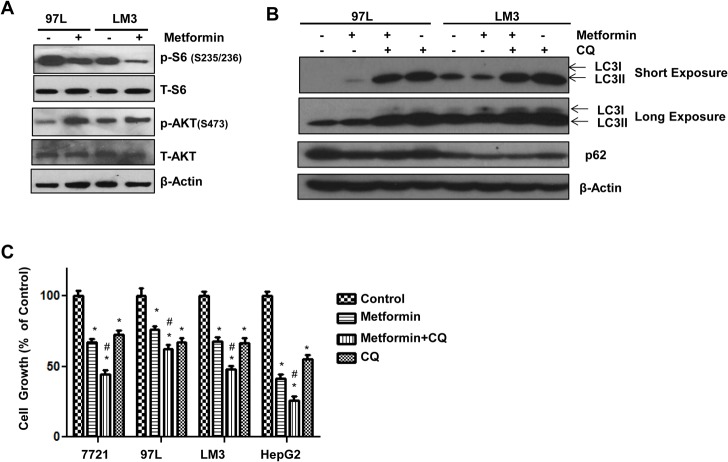
Fig 6. Pharmacological Suppression of autophagy sensitizes 7721, 97L, LM3 and HepG2 cells to metformin-induced inhibition of cell growth.
(A) 97L and LM3 cells were treated with metformin (10 mM) for 24 hours. Total cell lysates were subjected to immunoblot analysis and representative blots from 3 independent experiments are shown. (B) 97L and LM3 cells were treated with metformin (10 mM) in the presence or absence of CQ (20 μM) for 24 hours. Total cell lysates were subjected to immunoblot analysis. Representative blots are shown from three independent experiments. (C) 7721, 97L, LM3 and HepG2 cells were treated as in (B) for 72 hours followed by MTT assay. Data are presented as means ± SE (n = 3). *: p<0.05, treatment vs control, # p<0.05 metformin vs metformin+CQ (One-way ANOVA analysis).

