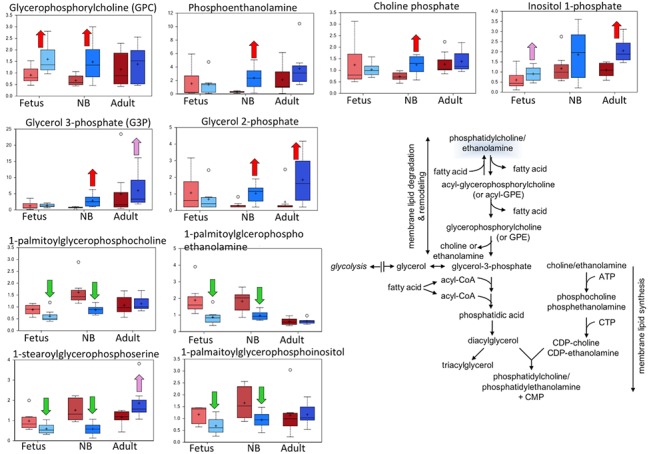
Fig 7. Box plots of the membrane lipid hydrolysis pathway comparing the six study groups.

In each diagram are shown from left to right: normoxic and hypoxic fetus; normoxic and hypoxic newborn (NB); and normoxic and hypoxic adult. The Fig also demonstrates an overview of the membrane lipid hydrolysis pathway Upward red arrow means significantly (P < 0.05) higher for the noted comparison. Downward green arrow means significantly (P < 0.05) lower for the noted comparison. Upward and downward arrows together means approach significance (0.05 < P < 0.1). N = 8 in each group.
