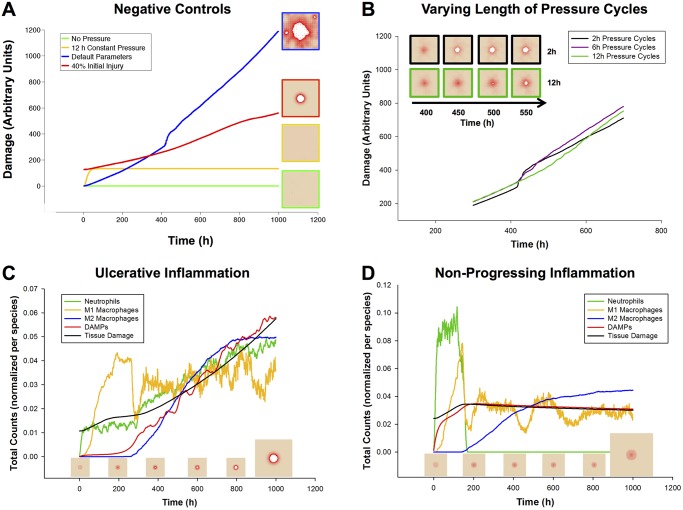
Fig 2. Model Verification: Mechanisms Lead to Expected Behaviors in Baseline Conditions.
(A) Negative controls verify that the model behaves as expected in various situations. Green: undisturbed, tissue health is stable for >5000 hours (data past 1000 h not shown). Yellow: an initial period of 12 h of ischemia causes damage to the tissue, but after release no further damage was incurred. Red: a characteristic damage curve for an ulcer caused by acute inflammation after 40% initial injury (similar to 2C). Blue: a characteristic damage curve for a pressure ulcer resulting from the default parameters for the model. (B) The ischemia/reperfusion injury mechanism was validated by varying the period of pressure (on/off) cycles. Increasing the length of a pressure cycle allowed us to decrease the number of reperfusion events over the same length of ischemia. Pressure switched from on to off (or vice versa) once every 2, 6, or 12 h. y-axis is total damage, x-axis is time (h). Pressure cycle length did not seem to affect the total amount of damage until just after t = 400 h. At that time point, the simulations with the shortest cycles (black) show a sudden increase in damage, which visually corresponds to the formation of an ulcer (see inset). Eventually, ischemic injury in simulations with the longest cycle length (green) causes these simulations to incur more overall damage. (C) A 35% initial injury without pressure is sufficient to induce self-perpetuating, damaging inflammation, leading to an ulcer. The relative dynamics of the response are as expected from the literature: an initial influx and activation of neutrophils, followed by M1 macrophages, and then followed by M2 macrophages. (D) In 10–20% of simulations with the same parameters and starting conditions, though the inflammatory response was incited, it did not become self-sustaining and consequently no ulcer formed. The trajectories of inflammatory cells are characteristic of each of these outcomes. Data were normalized per cell type, and so quantities are not relative.

