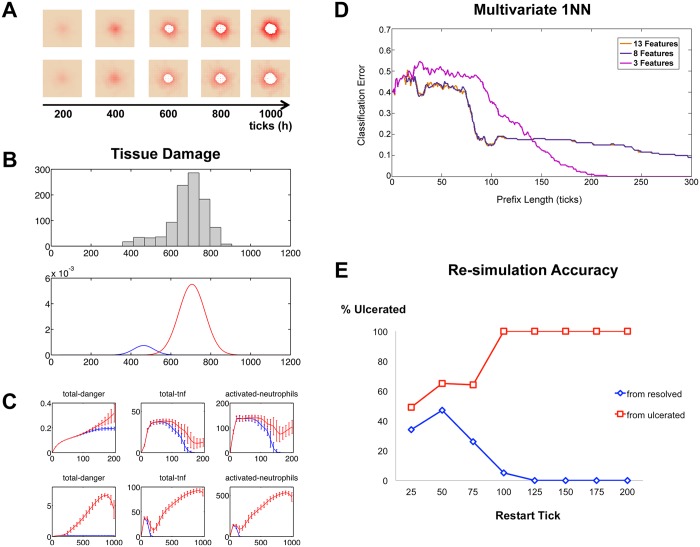
Fig 4. Bimodal outcomes are determined by 125 ticks (5 simulated days) prior to the appearance of post-SCI ulcers.
Panel (A) shows two simulations that were initiated with the same set of parameter values but evolved different levels of damage over time. In panel (B) these levels are characterized by a bimodal distribution of tissue damage at tick t = 1000 (day 42). The upper panel is a histogram of these values and the lower panel shows the bimodal distribution estimated from 1000 simulations with the same parameters and initial conditions. (C) Some individual features display very different trajectories between resolved and ulcerated simulation outcomes. Means and standard deviations of 1000 simulations are plotted. Upper 3 panels are the features plotted over the first 200 ticks (8.3 days); lower panels show the full time course of 1000 ticks. (D) 1-Nearest Neighbor performance versus length of sequences in training set was determined for various numbers of included features. (E) Percent of simulations resulting in ulceration after restarting from saved states at indicated restart tick. The saved states were derived from simulations that originally resulted in either ulceration or resolving inflammation.

