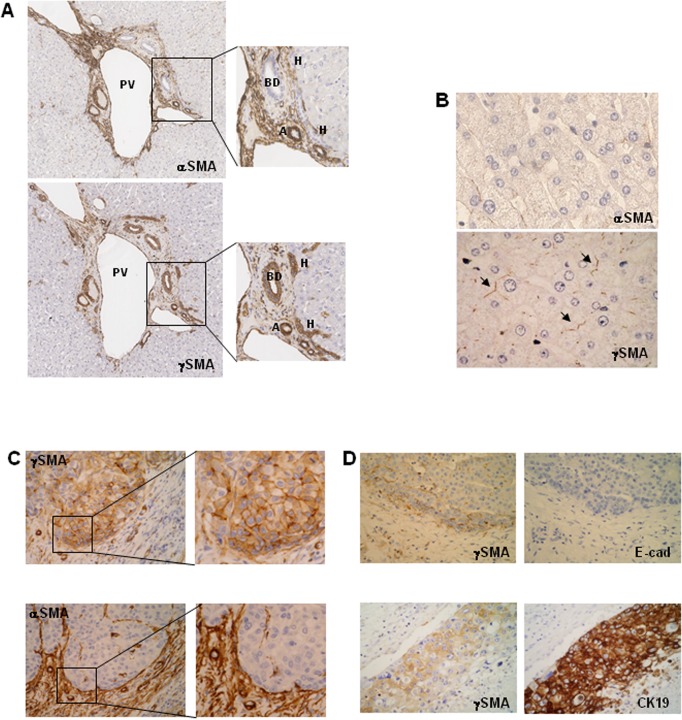
Fig 3. Immunochemical analyses of αSMA and γSMA expression in normal and HCC livers.
(A) Serial sections of normal livers were immunochemically stained with anti-αSMA or anti-γSMA antibodies. BD: bile duct, A: artery, H: canal of Hering, PV: Portal Vein. x50. (B) Sections of normal livers were immunochemically stained with anti-αSMA or anti-γSMA antibodies. (→: canaliculi) x400. (C) (D) HCC nodules were immunochemically stained with different antibodies. Serial sections stained with γSMAand αSMA; x160 and x400 (C). γSMA and E-Cadherin (E-cad); γSMA and CK19 (D). x160.

