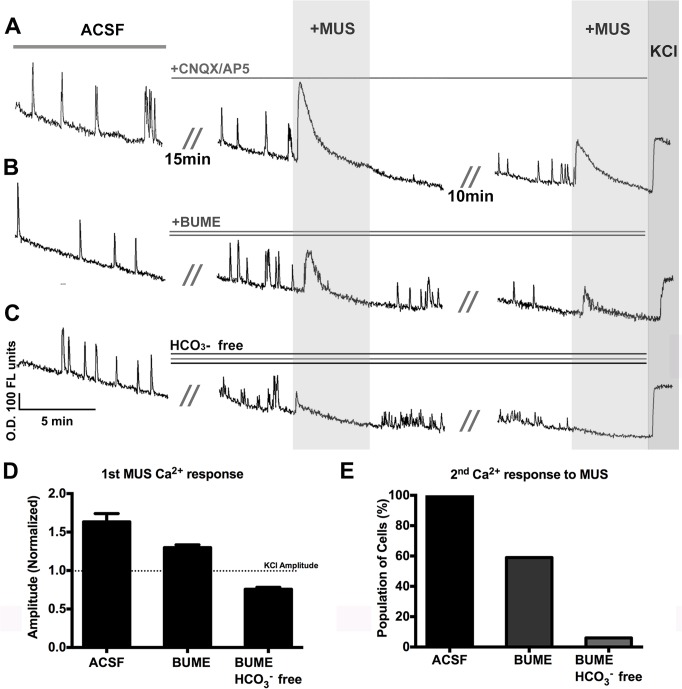
Fig 5. Inhibition of NKCC1 and removal of HCO3- attenuates response to MUS.
Recording periods consisted of: 1) baseline recording in ACSF, 2) application of CNQX/AP5 (10 μM each) followed by MUS (10 μM), and 3) second exposure to MUS (10 μM), followed by KCl (20mM). Groups compared were: A) Control B) BUME (NKCC1 inhibited), and C) HCO3 - free ACSF with BUME. Due to general fluorescent rundown in ACSF, all responses were normalized to KCl stimulus at the end, and amplitude comparisons were made. D) Amplitude of the 1st calcium responses to MUS. E) Percentage of cells retaining a calcium response to the second application of MUS. O.D. = optical density.

