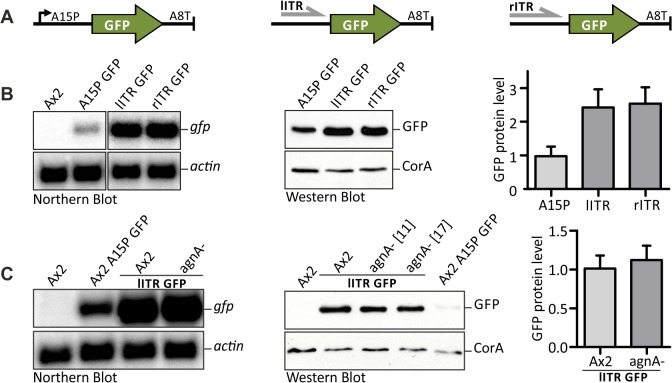
Fig 1. Analysis of ITR promoter activity.
(A) The GFP coding region was inserted between actin15 promoter (A15P) and actin8 terminator (A8T), DIRS–1 left ITR (lITR) and A8T, inverted DIRS-1 right ITR (rITR) and A8T. (B) Detection of GFP mRNA expression in Ax2 wild type driven by the constructs depicted in Fig 1A. As a loading control, the blot was rehybridised with a 32P labelled oligonucleotide directed against actin (left panel). Western blot shows GFP protein expression in Ax2 wild type driven by the constructs depicted in Fig 1A. Coronin A (CorA) was used as a loading control (middle panel). The right panel shows the corresponding quantification of Western blots. Analysis was performed using ImageJ. Ax2 A15 GFP: n = 8. Ax2 lITR GFP: n = 4. Ax2 rITR GFP: n = 4. Error bars: mean with SD. (C) Detection of mRNA expression (left) and protein level (middle) for GFP driven by the lITR in Ax2 wild type and agnA knock-out (agnA-) cell lines. Numbers in square brackets indicate numbers of independent populations. The right panel shows the corresponding quantification of Western blots. Analysis was performed using ImageJ. Similar results were obtained with the right ITR (data not shown). Ax2 lITR GFP: n = 4. agnA- lITR GFP: n = 4. Error bars: mean with SD.

