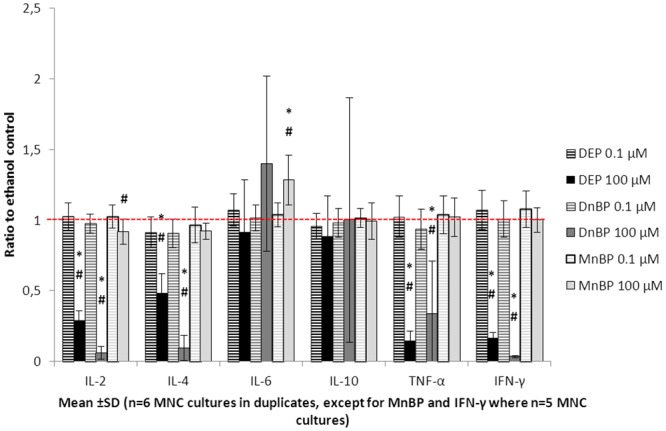
Fig 2. Influence of phthalates on T-cell responses.

MNC cultures were stimulated with phytohemagglutinin-P and exposed to di-ethyl phthalate (DEP), di-n-butyl phthalate (DnBP) or mono-n-butyl phthalate (MnBP), at two different concentrations, for 20–22 hours. The resulting production of IL-2, IL-4, IL-6, IL-10, TNF-α and IFN-γ are shown as ratios to the respective ethanol control. The red dashed line indicates the level of the ethanol controls (ratio = 1). * = p<0.05 compared to ethanol control, # = p<0.05 compared to low phthalate exposure (0.1 μM).
