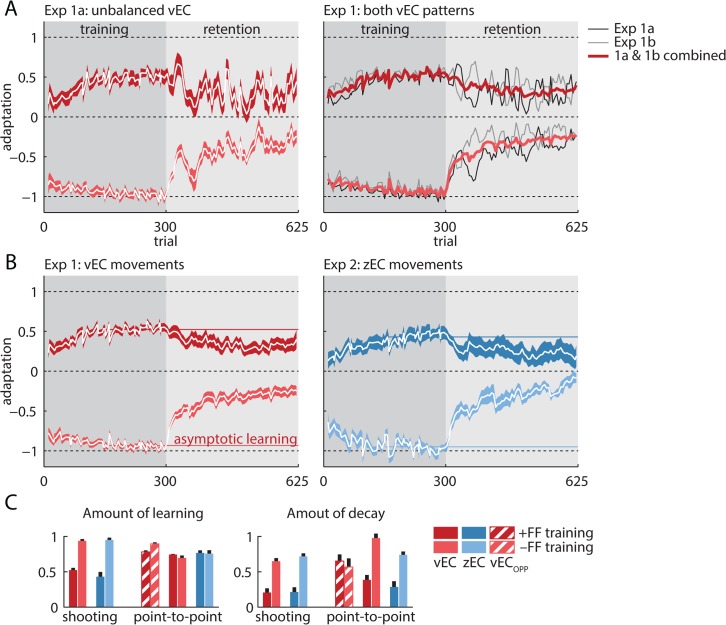
Fig 3. Raw learning and decay.
(A) Left panel: motor adaptation and its decay during the training and retention periods in experiment 1a. There is clear adaptation, corresponding to the separation between the +FF and −FF groups (dark & light red) during training, and also clear decay, corresponding to the reduction of this separation during the retention period. However, there are large-amplitude oscillations in the retention period that obscure the underlying decay, especially if the +FF data are considered in isolation. Right panel: experiment 1b (mean shown in gray), which used the mirror-opposite vEC sequence, also shows large oscillations during the retention period but opposite in direction to the experiment 1a oscillations (mean shown in black). Combining the data from the two experiments (mean shown in red) balances the vEC sequence and largely eliminates the decay-obscuring oscillations, suggesting that they result from the specific vEC sequence employed. The vEC-balanced data reveal clear monotonic decay for both FF directions. (B) The learning and decay curves for the vEC-balanced experiment 1 data (red) and the zEC experiment 2 data (blue) closely match, suggesting little effect of context change salience on decay. In both cases, the +FF subgroups (darker colors) displayed highly attenuated learning and decay that was small but significant. In contrast, the −FF subgroups (lighter colors) displayed strong learning and robust decay. (C) Asymptotic learning was quantified using the average adaptation in the last 150 trials of the training block (100 trials for point-to-point zEC). Decay was quantified as the difference between asymptotic learning and the mean of all the retention trials after the first 150. These quantifications capture the asymmetries observed in the learning and decay curves (light versus dark bars), but more importantly show similar zEC and vEC learning (left panel) and decay (right panel), for both shooting and the point-to-point movements. For point-to-point movements, the hatched bars are experiment 4 (vECopp) in the 90° direction, which is opposite to the zEC movement direction. The red and blue solid bars represent experiments 4 and 5 (vEC and zEC) in the 270° direction. Error bars show SEM.

