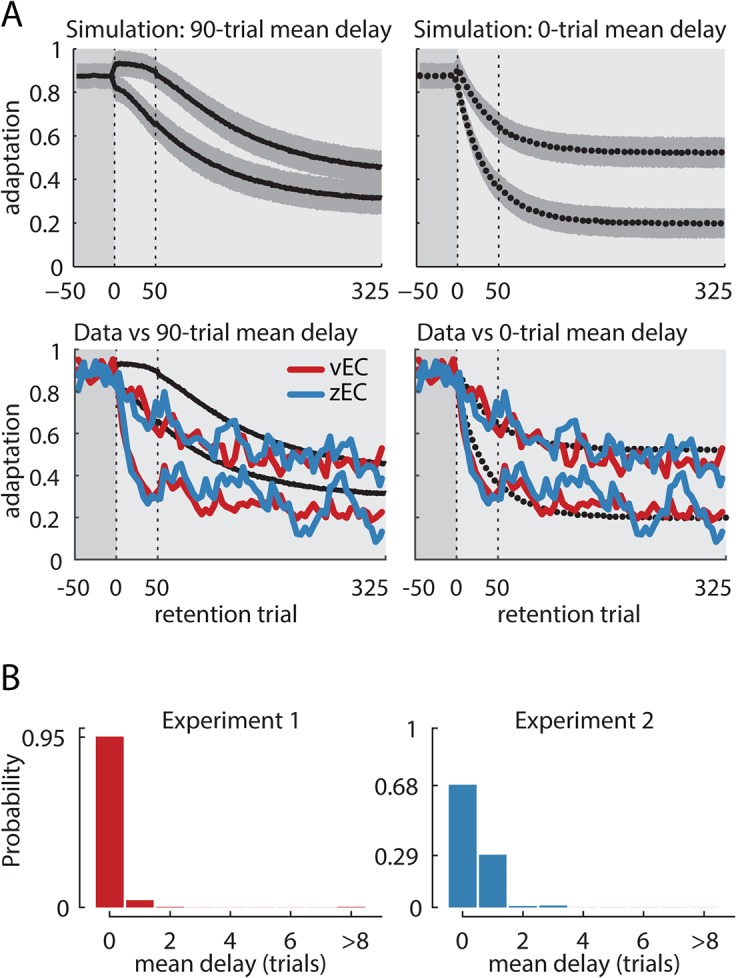
Fig 5. Group-level analysis of mean decay onset time.

(A) Top row: Simulated decay for scenarios with subjects having an exponential distribution of delays with means of 90 and 0 trials. For each scenario, we simulated 40 subjects and median divided them into two equal groups based on their decay during the first 50 trials of the retention period. The black curves show the mean decay obtained from 1000 such simulations with shading corresponding to the standard deviation across simulations. The low-decay subgroups for the simulations with a 90-trial mean delay show no early decay, quantified as the ratio between decay in the first 50 vs the last 75 retention trials, and it even has slightly elevated average adaptation in the first 50 trials due to a selection bias (see Results). In contrast, both subgroups from the simulations with a 0-trial mean delay decay immediately. Second row: The data from experiments 1–2 were median-divided in the same way, based on the amount of decay during the first 50 trials. The means of each of these subgroups are plotted in red and blue for vEC and zEC, respectively. For both experiments, the experimental data appear consistent with the simulations for zero-delay but not 90-trial mean delay (dotted vs solid lines). Note that the simulated curves are smooth because they represent the mean of 1000 simulations, where individual simulations vary much like the data do. (B) Estimates of the mean delay in our data using a Bayesian inference procedure based on the early decay ratios. We used simulations to estimate the joint distribution P(EDhigh, EDlow | μλ) for the mean delay μλ and the early decay ratios EDhigh and EDlow. This is a likelihood function for μλ. We then assumed a uniform prior over the integer mean delays from 0 to 90 trials to estimate the posterior distribution P(μλ | EDhigh, EDlow), which is proportional to P(EDhigh, EDlow | μλ) ∙ P(μλ) (see Methods). Large mean delays support the context detection hypothesis, which predicts decay to begin only after a change of context is detected. Near-zero delays are at odds with the context detection hypothesis because changes in variability cannot be detected immediately. The posterior distribution for experiments 1 (left) and 2 (right) are heavily skewed toward immediate decay, with a maximum a posteriori delay estimate of zero trials in both cases. The 95% confidence interval is 0 trials for experiment 1 and 0–1 trials for experiment 2, whose interval is somewhat more diffuse because it had 20 rather than 40 participants. These results are in stark contrast to the 90 and 40 trial mean delays reported for vEC and zEC shooting experiments in V&S, respectively.
