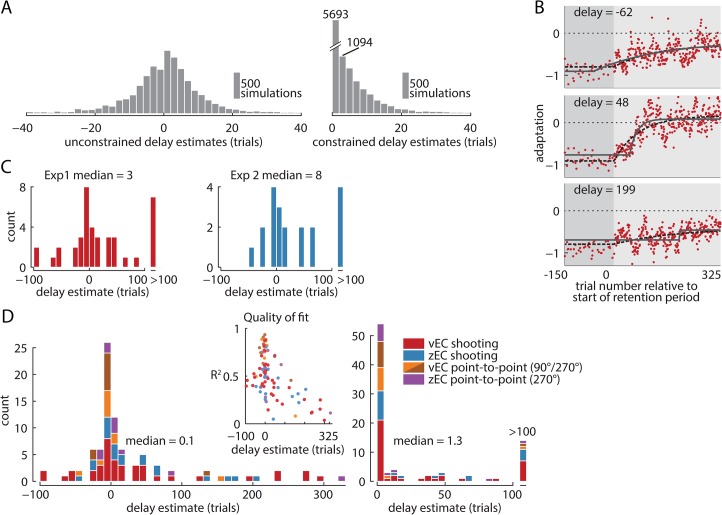
Fig 6. Individual-level analysis of decay onset time.
(A) Distributions of delay parameter estimates obtained from fitting a delayed exponential to simulated noisy zero-delay data. Fits that did not constrain the delay parameter (left panel) resulted in a distribution of delay estimates centered near zero trials after the retention period onset with some positive and some negative delays. In contrast, constraining the fit delay to be non-negative (right panel) shifts the left half of the unconstrained distribution to zero while preserving the right half. Using the latter procedure, it impossible to meaningfully test for the existence of a delay since even the zero-delay simulation results in only positive values, substantially biasing the average delay estimate. (B) Three example subjects from experiment 1 with best-fit delayed exponentials (black lines). These subjects had best-fit delays that were moderately negative (top), moderately positive (middle), and highly positive (bottom). The dashed line represents the best-fit zero-delay exponential. (C) Delay parameter estimates for experiments 1 and 2 are centered near zero, with some positive and some negative estimated delays. The vEC condition (experiment 1) does not show more delay than the zEC condition (experiment 2), despite the masked context change that should make this change take longer to detect. (D) Histogram of delays aggregated across all experimental conditions based on unconstrained (left panel) and constrained (right panel) fits of the delay parameter. The right panel shows many positive delays but the potential negative delays that could balance these are not permitted by the fitting procedure so the significance of the positive delays cannot be discerned. In contrast, the left panel shows most delay estimates to be near zero, and is well-balanced between positive and negative values. The inset shows that the subjects who were well-fit by a delayed exponential tended to have delays near zero, while subjects who were poorly fit had delays more uniformly spaced throughout the fitting window [−100, 325], suggesting that the large amplitude delays likely arose from poor fitting rather than the existence of truly delayed decay behavior. These results are consistent with the group-level analysis.

