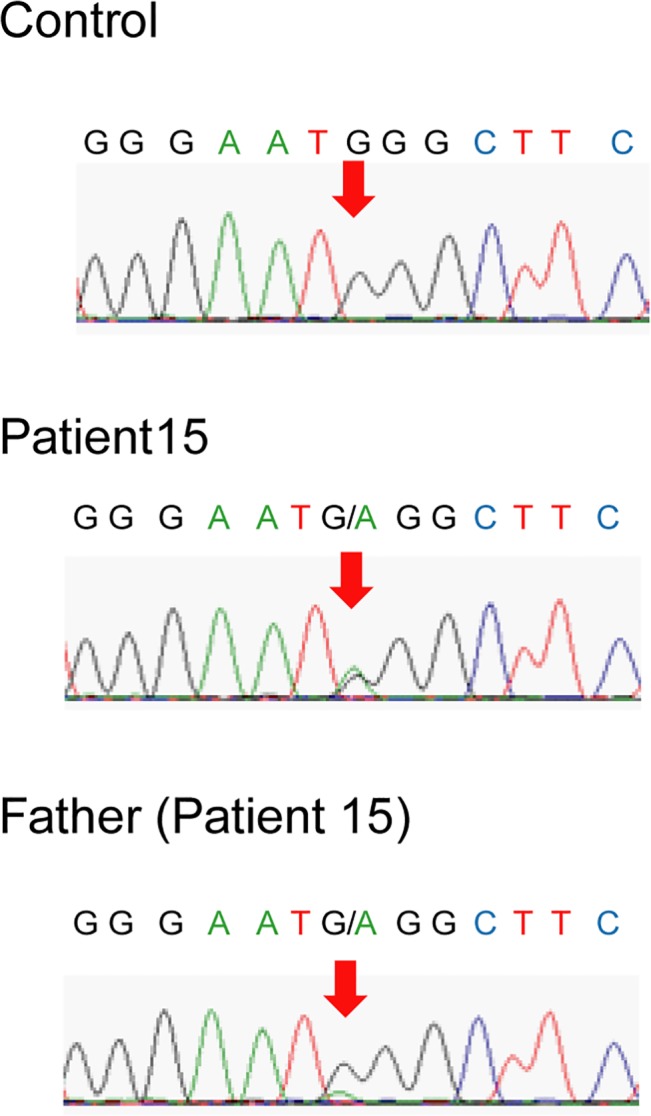
Fig 2. Sequence Electropherograms of Patient 15.

Sequence electropherogram of control (upper), patient 15 (middle) and his father (bottom). The peak of the mutant ‘a’ allele in 7024 residue (red arrow) was lower than the original ‘g’ peak in the sequence electropherogram of the father, which suggested the presence of mosaicism.
