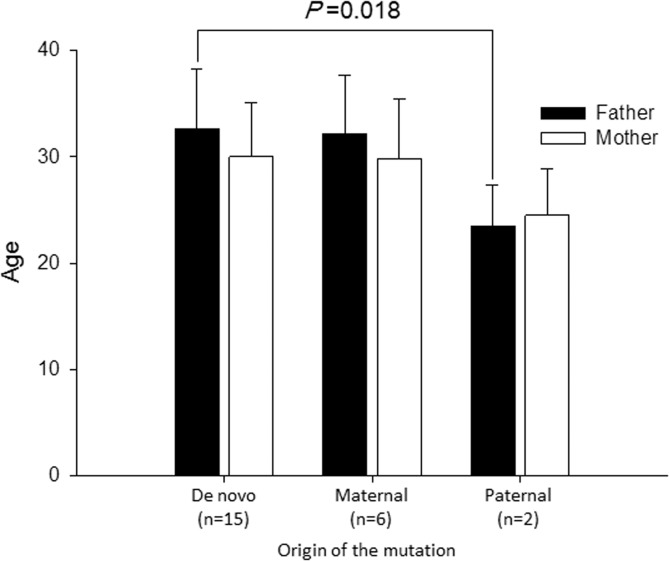
Fig 3. Mean Age of parents depends on the RYR2 mutation origin.
Bar graphs depict mean ages of parents at the birth of probands. Filled bars indicate those of fathers and open bars those of mothers. The mean age of genotype-positive fathers was significantly younger than that of the de novo mutation group.

