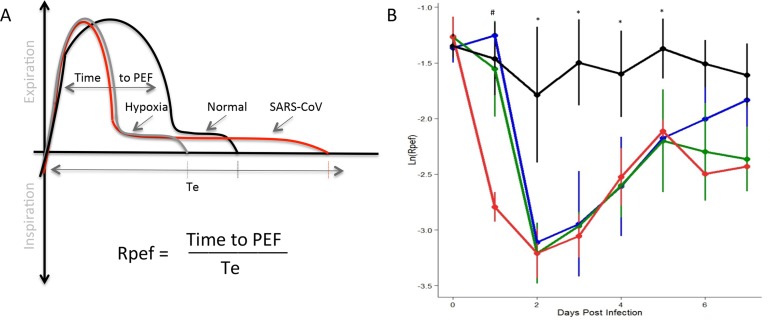
Fig 4. The shape of the exhalatory flow curve (Rpef) indicated changes following infection with SARS-CoV.
(A) Rpef measures the ratio of time to peak expiratory follow (PEF) relative to the total expiratory time. For both hypoxia (gray) and SARS-CoV infection (red), the time to PEF decreases relative to normal (black). However, the length of breath expands following SARS-CoV infection, causing significant drop in Rpef values relative to baseline. (B) Following SARS-CoV infection of C57BL/6J animals, we identified significant differences in Rpef across a range of doses relative to mock animals (black = mock, blue = 10^3 SARS, green = 10^4, red = 10^5; four animals per group). Significant effects of treatment on Rpef was determined via partial F-test. Following significance assessment, those treatment groups different from each-other were assessed by Tukey’s HSD post-hoc analysis. All such differences are denoted at a p<0.05 level, and are marked as follows: * = mock different from all infected, # = 10^5 dose different from all others.

