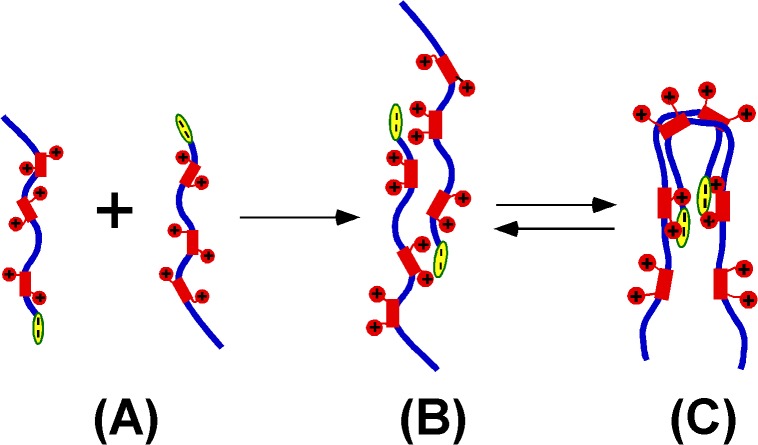
Fig 7. A possible model for the HMGA2 homodimerization.
Blue lines represent the protein backbone. Electrostatic interactions between the positively charged “AT hooks” (red rectangle with two red circles) and the negatively charged C-terminus (yellow oval) coordinate the dimer formation. (A) represents HMGA2 monomers. (B) and (C) represent different interchangeable conformations of HMGA2 homodimers. (C) is more consistent with our EDC cross-linking and sedimentation velocity results. The HMGA2 homodimers may be an ensemble of different conformers.

