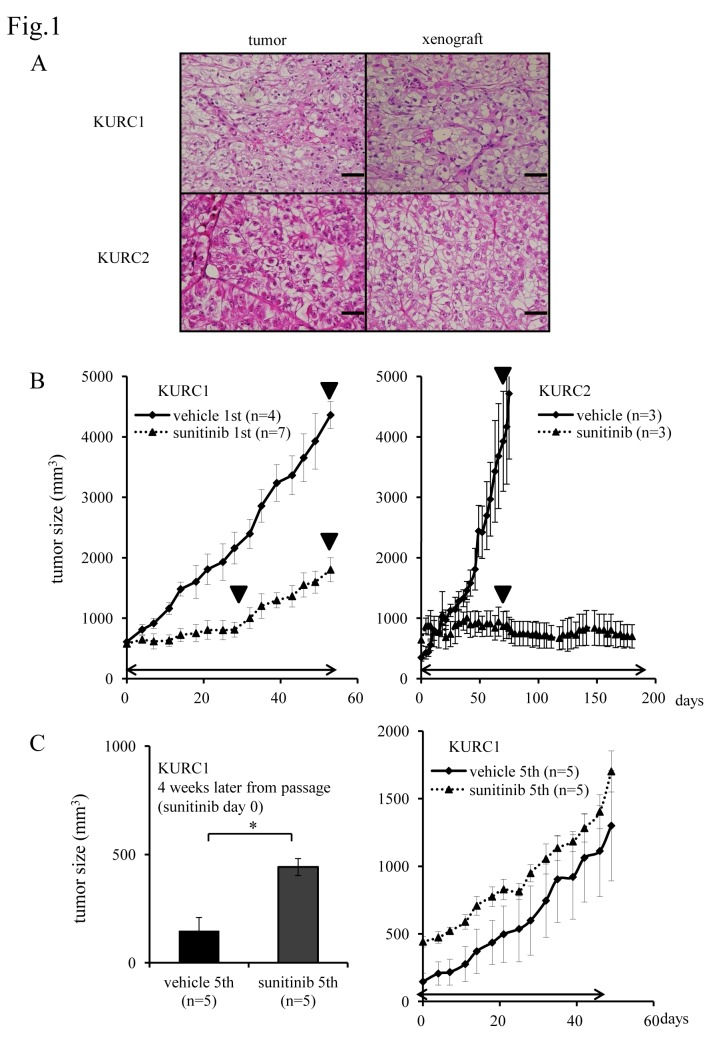
Fig 1. KURC1 tumors develop resistance to sunitinib but KURC2 remained sensitive.
(A) Hematoxylin and eosin (H&E) staining of an original RCC surgical specimen and xenograft KURC1 and KURC2 tumor tissue. Scale bar, 50 μm. (B) The sequential changes of KURC1 and KURC2 xenograft tumors treated with sunitinib or vehicle only and (C) Left: KURC1 tumor volume at 4 weeks later from passage (sunitinib treatment day 0). Right: The sequential changes of KURC1 sunitinib 5th and vehicle 5th. KURC1 repeatedly treated with sunitinib or vehicle 5th. Each time point represents the mean ± SE of tumor volume in each group. Day 0 is the first day of sunitinib administration at 4 weeks after transplantation. The difference in tumor size between sunitinib 5th group and vehicle 5th group in KURC1 was not statistically significant using two-way repeated ANOVA. Arrowed bars indicate the periods of sunitinib administration. ▼ indicates the time point when tumors were resected.

