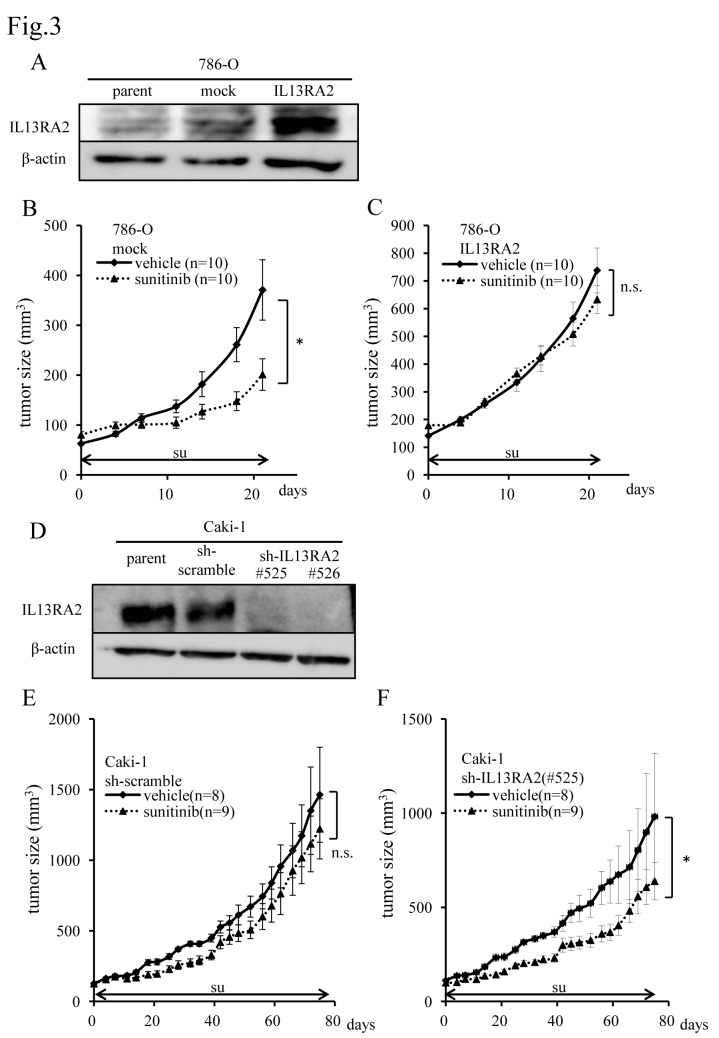
Fig 3. Overexpression of IL13RA2 leads to acquired resistance to sunitinib and shRNA-mediated IL13RA2 knockdown induces sensitivity to sunitinib.
(A) Immunoblot analysis of 786-O subclones infected with retrovirus encoding mock or WT IL13RA2. Whole cell extracts were immunoblotted using the indicated antibodies. Sequential changes in subcutaneous xenograft tumors from 786-O subclones infected with (B) mock or (C) WT IL13RA2 treated with sunitinib and vehicle (control). Each time point represents the mean ± SE of tumor volume in each group. The difference in tumor size between the treatment group and control was statistically significant in 786-O-mock cells but not statistically significant in 786-O-IL13RA2 cells (*P < 0.05, n.s.: not significant; two-way repeated ANOVA). The horizontal arrow bars indicate the periods of sunitinib administration. (D) Immunoblot analysis of Caki-1 subclones infected with lentivirus encoding scrambled or IL13RA2 shRNA. Whole cell extracts were immunoblotted using the indicated antibodies. Sequential changes of subcutaneous xenograft tumors from a Caki-1 subclone infected with (E) scrambled or (F) IL13RA2 shRNA treated with sunitinib and vehicle (control). Each time point represents the mean ± SE of tumor volume in each group. Day 0 is the first day of sunitinib administration 4 weeks after transplantation. The difference in tumor size between the treatment group and control was not significant in Caki-1-sh-scrambled cells but statistically significant in Caki-1-sh-IL13RA2 cells (n.s.: not significant, *P < 0.05; two-way repeated ANOVA). The arrow bars indicate the period of sunitinib administration.

