
Fig 4. Hematoxylin and eosin staining of representative sections from RAG1-/- mice inoculated with wt CHIKV.
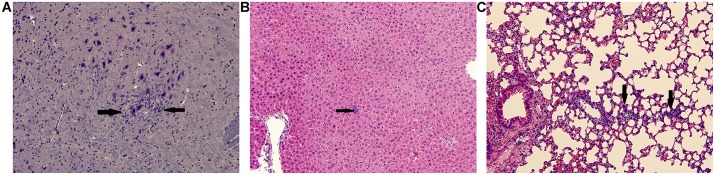
(A) Brain Day 28, (B) Liver Day 42, (C) Lung Day 42; all images were taken at 20x; scale bar is 200μm. Arrows indicate areas of inflammation.