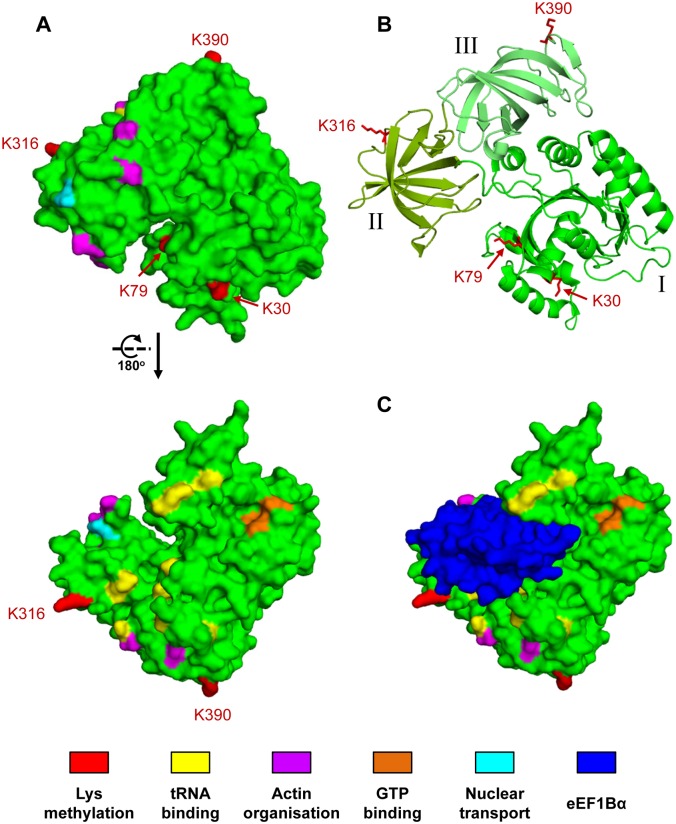
Fig 6. Visualisation of methylation sites and functionally important residues on the S. cerevisiae eEF1A three-dimensional structure.
The structures were generated from PDB 1IJE [47]. (A) Surface representation of eEF1A. Red (and labelled), Lys methylation sites (Lys30, Lys 79, Lys316 and Lys390); yellow, residues that, based on information from bacterial Ef-Tu, are predicted to interact with tRNA (Lys62, Arg69, Lys100, Asn101, Glu291, Arg320, His347, Lys406, Arg425) [45,46]; purple, residues implicated in actin binding and bundling (Asn305, Phe308, Asn309, Ser405) [48–50]; orange, residues involved in GTP binding (Asn153, Lys154, Met155, Asp156) [51]; cyan, residues involved in nuclear transport [50,52]. (B) the structure shown in (A) (upper panel) in ribbon representation. The three domains I, II, and III, that constitute eEF1A are indicated in distinct shades of green. (C) The eEF1A/eEF1Bα complex. The eEF1Bα subunit (in blue) is indicated on the structure shown in the upper panel in (A).

