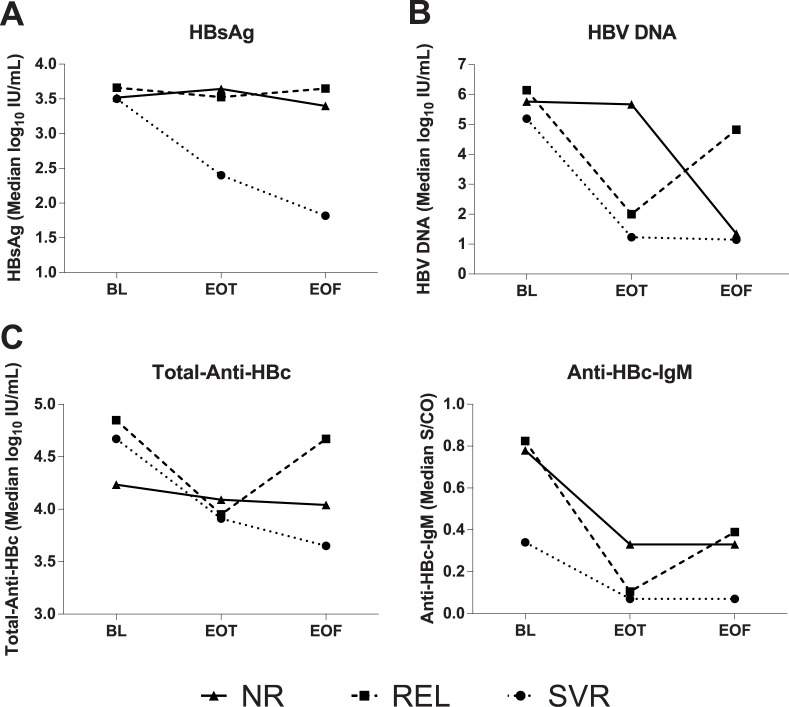
Fig 3. Kinetics of HBV markers in patients treated with Peg-IFN.
Kinetics of median values of HBV markers between baseline (BL), end of therapy (EOT) and end of follow-up (EOF) in 35 patients treated with Peg-IFN: 6 NR, 10 REL and 19 SVR. Patients who did not respond to IFN (NR and REL) were subsequently switched to NUC. P values: a) HBsAg: BL vs EOT 0.27 for NR, 0.50 for REL and <0.001 for SVR; b) HBV-DNA: BL vs EOT 0.59 for NR, 0.014 for REL and <0.001 for SVR; c) Anti-HBc-IgM: BL vs EOT 0.24 for NR, 0.01 for REL and 0.17 for SVR; d) Total Anti-HBc: BL vs EOT 0.39 for NR, <0.001 for REL and <0.001 for SVR.

